
Table of Contents
Why This Guide Matters in 2025
In 2025, the brutal truth is that value still hides in the shadows: across industries, fewer than one in ten minutes of process-cycle time actually creates something a customer would pay for—the other 90 % is consumed by waiting, hand-offs, rework and other silent drains on profit. Even organisations already running Lean Six Sigma seldom push process-cycle efficiency beyond 15 %, which means at least 85 % of effort is still pure waste.
That gap is your competitive springboard, and this guide shows you how to leap. Inside, you’ll grab a Value Stream Map Template, a TIMWOODS cheat-sheet tuned for digital workflows, a five-step map-analyse-improve framework, real-world KPI benchmarks, plus a VA, NVA, NNVA data collection table downloadable template you can deploy with your team tomorrow. By the end, you’ll know exactly where hidden waste lurks—and have the tools to start erasing it for faster flow, happier customers and healthier margins.
Quick Snapshot
- Core Definitions
- Value-Added (VA) — A step that directly transforms the product or service in a way the customer is happy to pay for.
- Necessary Non-Value-Added (NNVA) — No obvious customer value yet unavoidable today (e.g., safety or regulatory checks).
- Non-Value-Added (NVA / Waste) — Consumes time, money or energy without shaping the offer or delighting the customer.
- 3-Question VA Test
- Does the step physically or digitally change the product/service toward completion?
- Would the customer willingly pay for that change?
- Is it done right the first time, with no rework needed?
Answer “yes” to all three and the activity is VA; otherwise label it NNVA or NVA.
- TIMWOODS – The 8 Modern Wastes to Hunt Down
- Transportation
- Inventory
- Motion
- Waiting
- Over-production
- Over-processing
- Defects
- Skills (under-used talent)
What Value Really Means
Voice of the Customer
“Value” is never defined in the boardroom—it lives in the customer’s head. Voice of the Customer (VoC) is the disciplined way we capture and translate those expectations into measurable requirements:
| VoC Layer | What You Capture | Lean-Six-Sigma Term |
|---|---|---|
| Needs | High-level goals—“I want my package on time.” | Critical-to-Quality (CTQ) tree root |
| Wants | Preferences—“Real-time tracking would be great.” | Kano delighters |
| Dissatisfiers | Pain points—“Late packages ruin my event.” | Critical-to-Satisfaction (CTS) |
Why it matters:
- Alignment – Every improvement targets what customers prize, not what insiders assume.
- Prioritisation – Limited resources flow to CTQs that move Net Promoter Score, churn or revenue.
- Validation – VoC becomes the yardstick for verifying that a step is truly value-adding.
Practical VoC channels you can start (or sharpen) today: post-purchase surveys, support-ticket text mining, social-listening sentiment, on-site pop-ups and short, scheduled customer interviews. Feed the findings straight into your process maps and CTQ trees.
The 3-Question VA Test
Lean practitioners use a simple litmus test—ask these three questions for every step on your map:
| # | Question | If “Yes”… | If “No”… |
|---|---|---|---|
| 1 | Does the step physically or digitally transform the product or service toward completion? | Possible Value-Added (VA) | Go to Q2 |
| 2 | Would the customer willingly pay for that specific change or effort? | Likely VA | Go to Q3 |
| 3 | Is it done right the first time, with no corrections or rework later? | Confirmed VA | Non-Value-Added—classify as ♢ NNVA (necessary today) or ♢ Pure Waste |
How to apply the test effectively
- Run it live at the Gemba (where the work happens). Watch actual clicks, keystrokes, movements.
- Score in real time: use sticky notes or a digital whiteboard—green (VA), yellow (NNVA), red (waste).
- Quantify impact: log cycle time and defect data so you can size the prize of elimination or automation.
- Re-evaluate after changes: today’s NNVA (e.g., manual validation) can become tomorrow’s pure waste once you add an API or script.
Together, VoC insights define what counts as valuable, and the 3-Question Test pinpoints where that value is—or isn’t—created inside your process. Use them as paired tools to focus every Lean Six Sigma effort on the steps that truly delight customers and grow the bottom line.
The Three Activity Buckets
1. Value-Added (VA)
Definition – Steps that directly transform a product or service in a way the customer recognises and is happy to pay for.
Modern B2B & Digital Examples
| Context | Concrete VA Step | Why It Passes the 3-Q Test |
|---|---|---|
| SaaS onboarding | Auto-personalising the dashboard the moment a new user signs in (pulling their CRM data via API). | Digital transformation the user wants and would pay for; done once, no rework. |
| Manufacturing-as-a-Service | 3-D printing a customer-specific jig that shortens their assembly time. | Physical change valued by the buyer, first-time-right quality. |
| B2B consulting | Running a data-backed root-cause workshop that reveals actionable cost-drivers. | Direct insight the client is purchasing; workshop creates the deliverable. |
Rule of thumb: If a step changes form/fit/function and survives the customer’s budget cut, it’s VA.
2. Necessary Non-Value-Added (NNVA)
Definition – Activities that the customer would not pay for but you must perform today to satisfy regulations, safety, contractual or technological constraints.
Modern B2B & Digital Examples
| Context | NNVA Step | Why It’s Still Needed |
|---|---|---|
| Fin-tech platform | Quarterly SOC 2 Type II audit evidence collection. | Mandatory for market trust and legal compliance. |
| SaaS scale-up | Running an overnight database backup and integrity check. | Protects customer data and SLAs, even though they don’t “see” the step. |
| Global e-commerce | Generating EU VAT OSS reports in multiple schemas. | Required under EU tax law; penalty risk if skipped. |
Lean mindset: Automate, compress or piggy-back NNVA tasks on VA work (e.g., inline audit logging) so they consume the minimum possible time and resources.
3. Pure Non-Value-Added (NVA / Waste)
Definition – Steps that consume time, money or energy while adding zero customer value and are not compulsory. These are prime elimination targets.
Typical 8-Waste Manifestations in 2025 Workflows
| Waste (TIMWOODS) | Digital-Age Example | Quick Fix |
|---|---|---|
| Transportation | Copying data from CRM ➜ Excel ➜ ERP by hand. | RPA or direct API integration. |
| Inventory | Paying for 2,000 unused SaaS seats after M&A. | Rightsize licences monthly. |
| Motion | Engineers scrolling through eight tools to find ticket status. | Unify with a single work-management hub. |
| Waiting | Dev team idle for VP email sign-off on a hot-fix. | Delegated approval matrix / policy automation. |
| Over-production | Shipping features no user requested (feature bloat). | Use A/B data + roadmap pruning. |
| Over-processing | Re-formatting the same KPI deck to five slide templates. | Standardise template; auto-populate charts. |
| Defects | Bug-fixing code that broke because tests ran in the wrong env. | Shift-left CI/CD with container parity. |
| Skills | Senior data scientists cleaning CSVs manually. | Delegate via scripts or junior analyst playbooks. |
Take-away: NNVA may deserve minimisation; pure NVA demands eradication. Map each step, tag it to one bucket, then attack the reds (pure waste) first for the fastest ROI.
Why the Distinction Drives Profit & CX
When you consistently tag every step in your workflow as VA, NNVA or pure waste, you unlock a triple win—lower costs, faster throughput and happier customers. The numbers behind recent Lean Six Sigma projects tell the story:
- Cost & Margin
‣ Organisations that run a rigorous value analysis report 15 – 25 % overall cost savings after stripping NNVA and waste from their processes.
‣ A North-American telecom deployment shaved 10 % off operational spend while cleaning up its process map. - Speed & Working Capital
‣ An automotive case study cut end-to-end cycle time from 47 days to 7 days—an 85 % acceleration—freeing US $22 million in working capital and wiping US $400 k in overtime off the books.
‣ Healthcare teams using the same VA/NVA discipline slashed patient wait times by 45 %. - Customer Loyalty (CSAT / NPS)
‣ The telecom initiative above also delivered a 20 % lift in customer-satisfaction scores—a movement large enough to shift Net Promoter Score.
‣ Process-focused CX projects commonly see 40 – 45 % jumps in satisfaction metrics, proving that customers feel the impact of waste removal.
‣ Industry guidance now pairs Lean Six Sigma with NPS tracking to create a closed feedback loop—use VoC data to pinpoint pain points, then DMAIC to remove them, and watch loyalty climb.
Bottom-Line Take-Aways
- Profit follows focus: every hour no longer burned on rework or manual checks flows straight into margin or reinvestment.
- Speed sells: faster cycle times compress lead-to-cash and inventory, fuelling cash flow and agility.
- CX is structural, not cosmetic: eliminating waste improves what customers feel—response time, accuracy, ease—so NPS rises organically.
Ready to attack the root causes behind your own waste? Dive into our step-by-step root cause analysis guide for the proven toolkit to target and remove them.
By quantifying VA vs NVA, you’re not tinkering at the edges—you’re rewiring the engine that drives both profit and customer love.
Meet TIMWOODS—The 8 Modern Wastes
Bookmark this table—or turn it into a sticky sidebar infographic—for instant, scroll-proof reference.
| Waste | Quick Definition | 2025 Digital-Age Example | Fast Counter-Move |
|---|---|---|---|
| 🚚 T – Transportation | Unneeded movement of products, data or people | Copy-pasting CRM records into a spreadsheet, then uploading to ERP | Build direct API or RPA pipeline |
| 📦 I – Inventory | Excess materials, WIP, data or licences | Paying for 2 000 unused SaaS seats after an acquisition | Monthly licence true-up & usage dashboards |
| 🏃 M – Motion | Extra employee movement or clicks | Engineers hunting through 8 tools to find ticket status | Consolidate into a single work-management hub |
| ⏳ W – Waiting | Idle time for people, info or machines | Dev team blocked for VP email sign-off on a hot-fix | Policy-based delegated approvals / automation |
| 🏭 O – Over-Production | Making more/faster than demand | Shipping un-validated features that inflate codebase | Data-driven roadmap & feature-toggle release |
| 🎛️ O – Over-Processing | Doing more work than the customer needs | Re-formatting the same KPI deck into five brand-slide templates | Standardised template + auto-populate script |
| ⚠️ D – Defects | Errors that cause rework or scrap | Bug-fixing code that failed because tests ran in the wrong env | Containerised CI/CD + test-parity |
| 🧠 S – Skills (under-utilised talent) | Not tapping employees’ creativity & expertise | Senior data scientists cleansing CSVs by hand | Self-service ETL tools & junior analyst SOPs |
How to use this table
- Print or embed it beside your value-stream map.
- Walk the gemba and tag each step with the matching waste emoji/GIF.
- Prioritise fixes that hit multiple wastes or free up scarce talent first.
Remove even one row’s worth of waste and you unlock cost, speed and CX gains—fast.
Step-by-Step Identification Framework
1. Map Your Current State (Value-Stream Map)
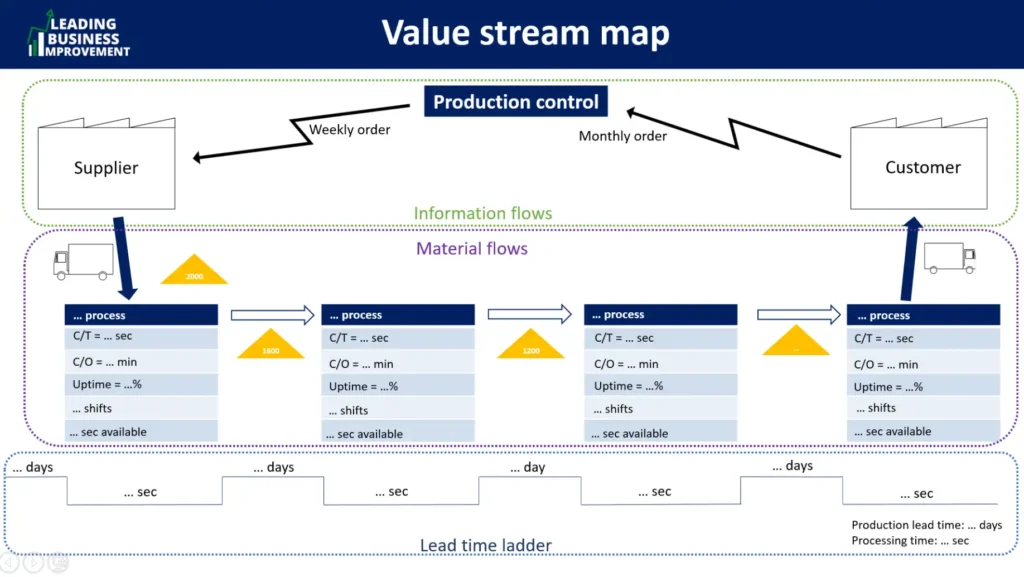
👉 Download this Value-Stream Map PPT Template
A current-state value-stream map (VSM) is your X-ray of how work really moves—from first customer request to final delivery. To build one:
- Gather a cross-functional team (process owner, operators, IT, finance).
- Define the boundaries: clear “start” and “stop” points, one product/service family at a time.
- Walk the flow chronologically, capturing every activity box, decision diamond and data flow—including digital hand-offs such as API calls or ticket queues.
- Write time data beneath each step
- Process Time (PT) – how long the work is actively touched.
- Wait Time (WT) – delays, queues or batch holds.
- Tag each step as VA 🟢, NNVA 🟡 or Waste 🔴 (use the TIMWOODS table for quick colour coding).
- Calculate totals: sum PT vs WT to expose the percentage of true value. Even mature teams are surprised how small that green slice is.
- Snapshot pain points visually—bottleneck icons, inventory triangles—so decision-makers grasp them in seconds.
Tip: For fully digital workflows, export event logs from tools like Jira, ServiceNow or Git and overlay them on the VSM to trace invisible data hops.
2. Gemba Walk & Front-Line Interviews
A map alone is theory; gemba (“the real place”) uncovers reality:
- Observe where the work happens – factory floor, customer-support pit, developer repo, even a Zoom screen-share for remote teams.
- Ask open questions – “What slows you down here?”, “Where do errors creep in?”, “If you could remove one step, which would it be?”
- Document motion and waiting – video or timestamped photos help quantify micro-delays later.
- Harvest improvement ideas straight from operators—they often know the quickest wins hiding in plain sight.
- Validate VSM accuracy – ensure the boxes and times you drew match lived experience; revise on the spot.
Pair the walk with front-line interviews (5 Whys, cause-effect diagrams) to turn anecdote into root-cause insight. Respect psychological safety—no blame, only process focus.
3. Quantify with Flow Metrics (CT & FTY)
Numbers turn coloured sticky notes into a business case:
| Metric | Formula | Why It Matters |
|---|---|---|
| Cycle Time (CT) | End-to-end elapsed time (Receipt → Delivery) | Reveals speed; target CT cuts justify automation and resourcing. |
| First-Time Yield (FTY) | Good Units Out ÷ Total Units In | Shows “right-first-time” quality; low FTY signals hidden rework waste. |
| VA % of CT | Σ VA time ÷ Total CT × 100 | Expresses pure customer value in one hard-hitting number. |
| Roll-Throughput Yield (RTY) | Product of FTY across steps | Captures compounded defect loss; ideal for executive dashboards. |
How to capture quickly:
- Mine existing systems – SQL queries, JIRA APIs, PLC counters.
- Time-study samples – 20–30 observations per step give a dependable median.
- Visualise trends – simple run charts in your BI tool spotlight seasons, spikes and outliers.
- Set “break-even” goals – e.g., CT ≤ 10 days or FTY ≥ 98 %. These become DMAIC project CTQs.
With a mapped workflow, real-world observations and hard flow data in hand, you can pinpoint exactly which red steps to delete, which yellow steps to automate and which green steps to accelerate—turning Lean theory into measurable profit, speed and customer delight.
Digital Accelerators for 2025
In the automation Lean Six Sigma playbook for 2025, three technologies are doing the heavy lifting: AI-powered process-mining platforms, next-gen robotic process automation (RPA), and democratized low-code / no-code workflow builders. Pair them with DMAIC and you shorten the Define-Measure phases, turbo-charge Improve, and keep Control on autopilot.
1. AI-Powered Process Mining — From X-ray to Copilot
| Fast Facts | Detail |
|---|---|
| Market trajectory | Analysts peg the sector at US $2.7 billion by 2025 (41 % CAGR) |
| Leader badge | Celonis crowned a Leader in the 2025 Gartner® Magic Quadrant™ for Process Mining Platforms |
Why it matters to Lean Six Sigma
- Define: Upload system event logs and watch a living, object-centric map appear—no sticky notes required.
- Measure: AI highlights “happy paths” vs. rework loops, giving instant baseline σ-levels.
- Improve: Built-in simulation suggests which waste (TIMWOODS) to tackle first and predicts ROI before you touch the process.
Trusted tools to explore: Celonis Process Intelligence, UiPath Process Mining, Microsoft Process Mining (inside Power Automate).
2. RPA 2.0 — Bots That Do the Busywork
| Fast Facts | Detail |
|---|---|
| Market outlook | RPA revenue on course for US $11 billion by 2027 |
| Typical payback | 6-12 months for high-volume clerical tasks (invoices, claims). |
Modern RPA layers computer-vision, NLP and Gen-AI “copilots” on top of UI recorders, letting Green Belts automate rule-based steps without writing code.
- Measure: Drop a bot in shadow-mode to time how long “Paste-data-to-ERP” really takes.
- Improve: Replace that red NVA step with unattended bots; cycle-time and FTY jump overnight.
- Control: Dashboards log every bot click for audit-proof governance.
Trusted tools to explore: UiPath StudioX, Microsoft Power Automate Desktop, Automation Anywhere A360.
3. Low-Code / No-Code Workflows — Citizen Kaizen at Scale
| Fast Facts | Detail |
|---|---|
| Adoption surge | 350 000+ enterprises already use Microsoft Power Automate for workflow automation |
| 2025 upgrades | The new AI-first release wave adds natural-language flow design, ROI analytics and self-healing automation |
Drag-and-drop builders let frontline teams prototype fixes between Kaizen events:
- Trigger Gemba photos → OCR → defect ticket in minutes.
- Auto-route VoC survey results to DMAIC dashboards.
- Stitch RPA bots, process-mining alerts and human approvals into one continuous flow.
Trusted tools to explore: Microsoft Power Automate (cloud & desktop flows), ServiceNow App Engine, Zapier for Work, OutSystems & Mendix for enterprise-grade low-code.
Making Them Work Together
- Mine the as-is flow with AI process mining.
- Bot the repetitive waste revealed.
- Flow the hand-offs into a low-code orchestration that embeds metrics.
- Monitor CT, FTY and NPS live; feed data back into DMAIC for perpetual improvement.
Pro tip: tag each automation in your VSM so everyone sees the VA/NNVA/NVA impact at a glance—then shout about the wins in your next root-cause analysis sprint (internal link).
Harness these digital accelerators and you’ll convert Lean Six Sigma theory into lights-out execution—at the speed your 2025 customers expect.
Case Studies & Benchmarks
Mini-Story #1 – Manufacturing SME (Auto-Components, India)
Lean-Kaizen + VSM Deployment
| KPI | Before | After | Δ |
|---|---|---|---|
| Setting-time (wheel dressing) | ≈ 79 s | 27 s | -65.9 % |
| Direct operators | 10 | 6 | -40 % |
| Production lead-time | 18.0 days | 5.5 days | -69.5 % |
| Value-added time | 473 s | 117 s | -75.3 % |
Why it matters: The SME freed capacity equal to 2½ working weeks per order and eliminated re-work that previously cost ₹ 235k/yr, pushing on-time-delivery to ~100 %.
Mini-Story #2 – B2B SaaS / Network-Services Org (Call One)
Lean Six Sigma Green-Belt Project
| KPI | Before | After | Δ |
|---|---|---|---|
| Router-programming cycle-time | 29 min | 13 min | -55 % |
| Incorrect configs | Baseline (100 %) | 40 % of baseline | -60 % defects |
| Router order lead-time | — | -11 days | n/a |
Why it matters: Faster, first-time-right installs tightened cash-to-revenue, cut truck-rolls, and lifted customer NPS (internal data) after the first quarter.
Benchmark Takeaways
- Cost & Speed: Both cases show 40-70 % time cuts translate directly into lower WIP and carrying costs.
- Quality/NPS: Defect reductions (60 %+) drive immediate CX win.
- Cross-Industry Proof: Whether physical parts or cloud configs, the VA/NVA lens consistently surfaces big, quick wins.
Bottom-line: Distinguishing VA, NNVA, and pure waste is not academic—it moves both EBITDA and customer loyalty in the same direction.
Process value collection grid Template – From Insight to Impact
Turn today’s aha-moments into next-week wins with our Process value collection grid Template.
Grab the PPT file and start trimming waste in less than 30 minutes. 👉 Download Process value collection grid Template
| Step | What You’ll Do | Outcome |
|---|---|---|
| Identify | Map the flow and tag every step VA/NNVA/Waste | A crystal-clear view of hidden drains on profit |
| Prioritise | Rank opportunities by effort × impact | A short-list of high-ROI fixes your team can’t ignore |
| Pilot | Run a low-risk trial, capturing CT, FTY & VoC | Data-backed evidence that your idea works |
| Scale | Standardise, automate and track with live dashboards | Sustainable gains that keep margins and NPS climbing |
Common Pitfalls & How to Dodge Them
| Pitfall | Why It Hurts | Quick Fix / Dodge |
|---|---|---|
| Mistaking mandatory compliance for pure waste | Regulatory checks (e.g., SOC 2, VAT OSS) seem “non-value,” but fines or lost trust cost far more. | Tag them NNVA, then minimise with automation or inline logging rather than deleting outright. |
| Chasing perfection over progress | Waiting for a “100 % future-state map” stalls momentum; ROI evaporates. | Adopt a 60-day Kaizen cadence—ship small wins fast, then iterate. |
| Automating the waste you haven’t eliminated | RPA on top of a broken flow locks in bad design and technical debt. | Lean first, automate second: run the 3-Question VA Test before writing bot code. |
| Ignoring Voice of the Customer | Improvements that don’t move CTQs won’t budge NPS—or revenue. | Pipe VoC feeds (surveys, chat logs) straight into your CTQ matrix and prioritisation grid. |
| Mapping in the conference room, not at the gemba | White-board myths replace ground truth; hidden rework stays invisible. | Take the team to the work (or screen-share for remote); validate the VSM live with operators. |
| Siloed optimisation | One department cuts 50 % of its time, but downstream still waits. | Use end-to-end VSM boundaries and cross-functional squads; measure total CT, not local PT. |
| Metric overload | 30 KPIs confuse progress and sap analyst hours. | Start with four flow metrics (CT, FTY, VA %, RTY); add others only when they drive a decision. |
| Under-utilising talent (“Skills” waste) | Senior experts doing clerical fixes, juniors shut out of problem-solving. | Pair Green Belts with front-line staff for blitz improvements; rotate ownership to build bench strength. |
| Treating NNVA as untouchable | “We’ve always done it this way” keeps manual checks alive for years. | Challenge constraints quarterly—tech shifts fast; yesterday’s must-have may be tomorrow’s pure waste. |
| Zero-sum improvements | Saving costs by hurting CX (or vice versa) nets no strategic gain. | Balance the scoreboard: cost, speed and VoC metrics must all improve for a win. |
Remember: Value analysis is a living discipline. Re-run the tests after every regulatory change, tech upgrade or shift in customer expectations to stay ahead of waste before it creeps back in.
FAQs
1. Is quality assurance (QA) always non-value-added?
Not necessarily. Standalone inspection does not change the product and customers wouldn’t pay for it, so by Lean rules it is non-value-added but necessary (NNVA). However, when QA is built into the process (e.g., automated inline tests that prevent defects) it shortens lead-time and may satisfy the 3-Question VA test—transform, customer benefit, done right-first-time—effectively turning parts of QA into true value-added work.
2. What’s the difference between NNVA and pure NVA?
NNVA steps do not add customer value but are compulsory today because of safety, regulatory, or technical limits—think GDPR data checks or pre-flight inspections.
NVA steps add no value and are not mandatory—e-mailing the same report to five inboxes, or waiting for an unnecessary sign-off. These are the first candidates for elimination.
3. How much waste do most teams find the first time they map a process?
Studies show that in many industries < 5 % of total lead-time is true value-added—meaning 95 % is waste or waiting. Even mature operations average only 10 – 15 % process-cycle efficiency (PCE) on their first value-stream map.
4. Which TIMWOODS waste costs SaaS companies the most money?
Inventory in the form of unused software licences is the biggest drain: enterprises wasted an average US $18 million on idle SaaS seats in 2023, using barely half of what they bought.
5. Can a non-value-added step ever become value-added?
Yes. Lean sees processes as living systems: when you automate or integrate an NNVA task so it delivers a benefit the customer notices—faster delivery, higher quality—it can migrate into the VA bucket. For example, companies that converted lengthy manual inspections into real-time vision checks reduced defects and cycle-time, turning the once-mandatory cost into a value signal the customer appreciates.
Glossary
Value-Added (VA) — Activities that create direct customer value.
Steps that transform the product or service in a way the customer recognises and is happy to pay for; must pass the change-pay-right-first-time test.
Non-Value-Added (NVA / Waste) — Pure waste; first in line for elimination.
Any step that consumes time, money or energy but does not increase customer value and is not required by law, regulation or technology.
Necessary Non-Value-Added (NNVA) — Keep, but minimise and automate.
Work the customer won’t pay for yet is unavoidable today—typically for compliance, safety or technical reasons.
Takt Time — Pace of production to meet demand without over-production.
The Lean heartbeat: the maximum allowable time between the start of successive units to match customer demand (Takt = Available Time ÷ Customer Demand).
Muda — Waste; often classified by the TIMWOODS mnemonic.
Japanese for “futility” or “waste”; the umbrella term for any activity that consumes resources without delivering value.
TIMWOODS — The eight modern wastes to hunt down.
Transportation, Inventory, Motion, Waiting, Over-Production, Over-Processing, Defects, Skills (under-utilised talent).
Cycle Time (CT) — How long the entire process actually takes.
End-to-end elapsed time from customer request to delivery (includes wait + work).
First-Time Yield (FTY) — A step-level quality gauge.
The proportion of units that make it through a single step without rework: Good Units Out ÷ Total Units In.
Roll-Throughput Yield (RTY) — End-to-end defect-free probability.
Product of the FTY for every step in the flow; shows compounded quality losses.
VA % / PCE— The share of lead-time customers truly care about.
Σ Value-Added Time ÷ Total Cycle Time × 100 %; also called Process-Cycle Efficiency (PCE).
Gemba — Go see the process in action to learn the truth.
Japanese for “the actual place”; Lean principle of observing work where it really happens, not from a conference room.
Further Learning & Certification Paths
Business Process Management: Value & non-value | Certification Course
Buy Now for $19.99
Udemy prices may vary depending on applied coupons and promotional events.
- 🧑🏫 63 lectures
- ⌚ 4h 59m total length
- 🗃️ 8 downloadable resources
- 📜 Certificate of completion
- 👩🎓 4,559 students
- ⭐ 4.9 rating by 52 students
Offer ends in:

- Lean Six Sigma White Belt (Micro-Course) – Grasp the vocabulary and the DMAIC cycle in under one hour. Ideal primer before deeper belts.
- Lean Six Sigma Yellow Belt – Build practical skills in basic process mapping, CT/FTY calculation and waste hunting. Includes a mini-project template.
Conclusion & Next Steps
You’ve now seen how less than 10 % of typical process time is truly value-added, why the other 90 % drags profit and customer experience, and how to spot, rank and remove that drag with Lean Six Sigma tools, digital accelerators and a disciplined VA / NNVA / Waste lens. The playbook is simple:
- Map → Tag → Measure – Build your current-state VSM, colour-code each step, and capture CT, FTY and VA %.
- Attack the Reds First – Eliminate pure waste, automate the unavoidable, and compress the green value stream.
- Pilot Fast, Scale Smart – Use the downloadable Process value collection grid Template to run a 30-day experiment; lock in wins with low-code flows or RPA bots.
- Loop VoC into DMAIC – Let customer feedback steer every next improvement so NPS rises alongside margin.
Keep the Momentum
- Level-up with a Yellow or Green Belt to master statistical root-cause analysis.
- Deep-dive with our Value-Added vs Non-Value-Added Udemy course (80 % off code VA2025).
- Bookmark the companion post “10 Six Sigma Tools for Root-Cause Analysis” for when you need the next layer of precision.
Action beats intention. Start trimming waste today, and by this time next quarter you’ll see faster cycle times, lower costs and customers who can feel the difference. Happy improving!