

Six Sigma Tools List
Six Sigma, as the name suggests, is all about striving for perfection. It’s not just a cool name; it’s a data-driven business methodology aimed at reducing defects to an almost magical 3.4 defective parts per million, making products nearly flawless. Imagine a world where almost everything works perfectly – that’s the dream of Six Sigma.
Related: A process that performs at a Six Sigma level
Enrol in Lean Six Sigma Toolkit course and get certified.
Now, why is Six Sigma so important? Well, picture this: businesses are like intricate machines with lots of moving parts. Sometimes, these parts don’t fit quite right, causing hiccups and errors. That’s where Six Sigma comes in – it’s like the mechanic who fine-tunes those parts to make the machine run smoother than ever. So, in a nutshell, Six Sigma is the secret sauce that helps businesses fix their flaws and become super-efficient.
1. DMAIC and DMADV
DMAIC and DMADV are two methodologies commonly associated with Six Sigma, a data-driven approach to process improvement aimed at reducing defects and variations in products and services. Both methodologies originated from Motorola in the 1980s and were further developed and popularized by companies like General Electric.
DMAIC Overview and its Application in Root Cause Analysis
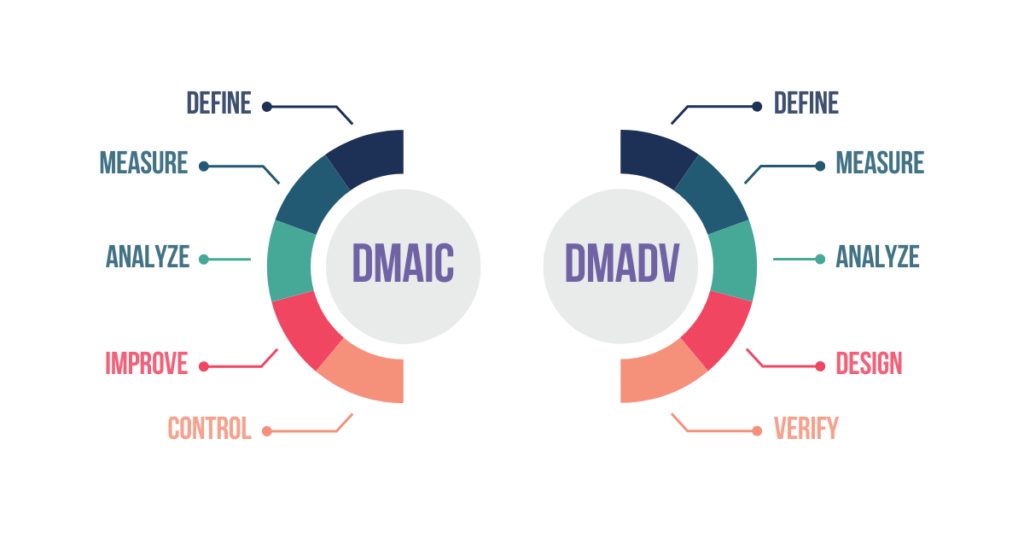
DMAIC stands for Define, Measure, Analyze, Improve, and Control. It is a structured, five-phase approach used to improve existing processes that are below standard or not meeting customer expectations.
- Define: This is where you figure out what’s going on and what needs fixing. It’s like putting on your detective hat and uncovering the mystery behind those pesky problems.
- Measure: Time to whip out the measuring tape! This step is all about collecting data to see just how big those problems really are. Think of it as taking inventory of all the issues.
- Analyze: Now comes the fun part – digging deep into the data to find out what’s causing all the trouble. It’s like being a detective but with numbers instead of clues.
- Improve: Here’s where the magic happens. Armed with all that data, you come up with clever solutions to squash those problems once and for all. It’s like giving your business a makeover!
- Control: Last but not least, you make sure those solutions stick. It’s like setting up guardrails to keep your business on the right track.
DMAIC was developed as a problem-solving methodology within the Six Sigma framework to address issues in manufacturing processes and business operations. It emphasizes data collection and analysis to identify root causes of problems and implement targeted improvements.
The DMAIC methodology aims to systematically identify areas for improvement, measure current performance, analyze data to identify root causes of defects or inefficiencies, implement solutions to address these root causes and establish controls to sustain the improvements over time. It’s like the superhero of Six Sigma – swooping in to save the day with its five-step process:
DMADV Overview and its Application in Root Cause Analysis
DMADV stands for Define, Measure, Analyze, Design, and Verify. It is a five-phase methodology used for designing new processes, products, or services that meet customer requirements and quality standards.
- Define: Just like in DMAIC, DMADV starts by setting the stage. Here, you define the goals and objectives of your new venture. It’s like sketching out the blueprint for your masterpiece, laying the groundwork for greatness.
- Measure: With your goals in place, it’s time to take stock of the current landscape. You gather data, analyze market trends, and assess customer needs to ensure you’re starting off on the right foot. It’s like surveying the terrain before embarking on an epic journey.
- Analyze: Armed with insights and information, you delve deep into the heart of your project. You identify potential risks, explore different design options, and map out the optimal path forward. It’s like charting a course through uncharted waters, navigating with precision and foresight.
- Design: Here’s where the magic happens. You unleash your creativity, bringing your vision to life through innovative design and meticulous planning. Every detail is carefully crafted to perfection, ensuring your end product exceeds expectations. It’s like sculpting a masterpiece, shaping raw materials into something extraordinary.
- Verify: With your creation taking shape, it’s time for the ultimate test. You validate your design through rigorous testing and prototyping, ironing out any kinks along the way. It’s like fine-tuning a symphony, ensuring every note resonates harmoniously.
Similar to DMAIC, DMADV originated within the Six Sigma framework and was developed to address the need for designing and implementing new processes that consistently deliver high-quality outcomes from the outset. It focuses on creating robust processes that minimize defects and variations.
The DMADV methodology is employed when existing processes do not exist or are inadequate for meeting customer needs. It emphasizes understanding customer requirements, designing processes to meet those requirements, verifying the effectiveness of the design, and ensuring that the new processes deliver the desired outcomes.
DMADV is like The cool cousin of DMAIC. While DMAIC is all about fixing existing problems, DMADV is about creating something brand-spanking new. It’s like DMAIC’s adventurous side, exploring uncharted territory to develop shiny new processes, products, or services.
Together, DMAIC and DMADV form a dynamic duo that drives continuous improvement and fuels innovation. Whether you’re solving problems or charting new frontiers, remember the power of this dynamic duo to drive excellence in everything you do.
2. The 5 Whys Method

The 5 Whys method is a problem-solving technique aimed at identifying the root cause of an issue by repeatedly asking “why” until the underlying cause is uncovered. It is a simple yet powerful tool for problem analysis and problem-solving.
A Brief Overview of The 5 Whys Tool
The 5 Whys method involves asking “why” repeatedly to explore the cause-and-effect relationships underlying a problem. Typically, the questioning process continues until the team reaches a point where further “why” questions no longer reveal new insights or until they identify a root cause that can be addressed. While there isn’t a specific set of questions for each “why” in the 5 Whys method, typically, each subsequent “why” question seeks to delve deeper into the root cause identified in the previous answer. The questions are iterative and aim to uncover deeper layers of causality until a satisfactory root cause is identified.
The 5 Whys method originated from the Toyota Production System and is closely associated with the development of lean manufacturing principles and practices. It was formalized and popularized by Taiichi Ohno, the father of the Toyota Production System, as a means of encouraging deeper problem analysis and fostering a culture of continuous improvement within Toyota and other organizations.
Enrol in The 5 Whys Diagram course and get certified.
The primary purpose of the 5 Whys method is to get to the underlying cause of a problem rather than just addressing its symptoms. By asking “why” multiple times, teams can uncover the deeper issues contributing to a problem, allowing them to implement more effective and sustainable solutions. The method helps prevent the recurrence of problems by addressing their root causes.
In problem-solving, the 5 Whys method serves as a structured approach to unravel the layers of causation behind an issue. It involves asking “why” repeatedly, typically five times, to drill down to the fundamental cause of a problem. Think of it as peeling an onion—each “why” reveals another layer until you reach the core.
Application in Root Cause Analysis
Let’s say a production line experiences a defect. Instead of stopping at the surface-level symptom, the team starts by asking why the defect occurred. With each answer, they delve deeper, asking “why” again. By the fifth iteration, they often reach the root cause—an underlying systemic issue like inadequate training or a flawed process. Its application in root cause analysis involves the following steps:
- Identifying the Problem: The process begins by clearly defining the problem or issue that needs to be addressed. This could be a defect in a product, a breakdown in a process, or any other undesirable outcome.
- Asking “Why?”: Once the problem is identified, the team asks why it occurred. The goal is to dig deeper and understand the root cause rather than focusing on surface-level symptoms. By asking “why” repeatedly, the team peels away layers of causation to reveal deeper insights.
- Repeating the Question: After each answer is provided, the team continues to ask “why” to delve further into the underlying factors contributing to the problem. This iterative process helps uncover multiple layers of causation until the root cause(s) are identified.
- Reaching the Root Cause: The process typically continues for five iterations, although it can vary depending on the complexity of the problem. By the fifth “why,” the team should ideally reach a root cause or a set of root causes that, when addressed, can prevent the problem from recurring.
- Addressing Root Causes: Once the root cause(s) are identified, the team can develop and implement corrective actions to address them effectively. These actions are aimed at eliminating or mitigating the underlying factors that contribute to the problem, thereby preventing its recurrence.
- Verification and Validation: After implementing corrective actions, it’s essential to verify their effectiveness and validate that they have effectively addressed the root cause(s) identified through the 5 Whys analysis. This may involve monitoring the process or system to ensure that the problem does not reoccur and that performance improves as intended.
- Continuous Improvement: The 5 Whys tool promotes a culture of continuous improvement by encouraging teams to look beyond immediate symptoms and address underlying issues. It can be used proactively to identify potential problems before they occur, as well as reactively to solve existing issues.
By going beyond the obvious and probing into deeper layers of causation, teams can uncover insights that lead to more effective solutions. The 5 Whys method fosters a culture of inquiry and continuous improvement, driving organizations toward long-term problem resolution and prevention.
3. The 5S System
A Brief Overview of The 5S System
The 5S System is a methodology for workplace organization and standardization, originating from Japan. It is a foundational aspect of Lean manufacturing and Six Sigma methodologies, aiming to improve efficiency, productivity, and safety in the workplace.
The Five Steps and their Application in Root Cause Analysis
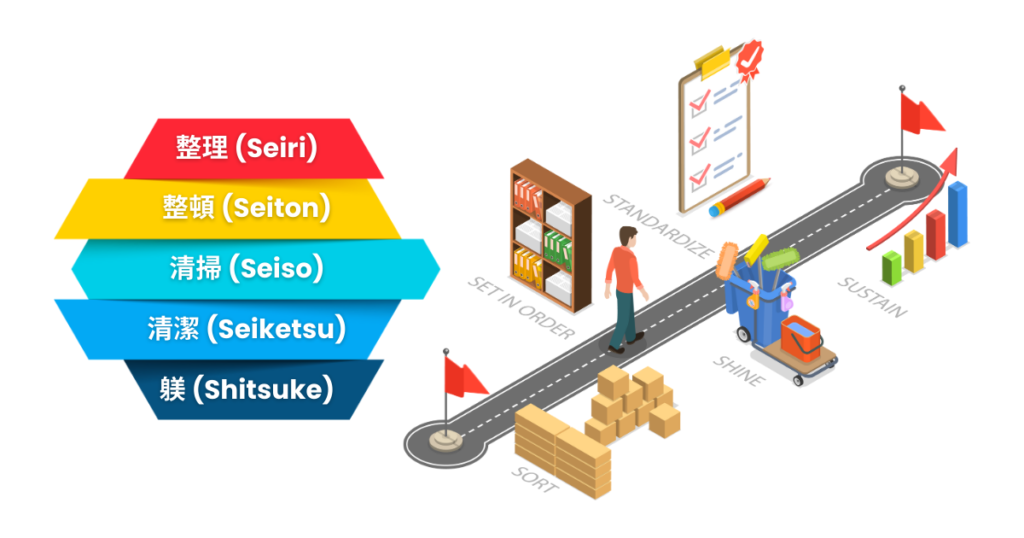
The term “5S” is derived from five Japanese words, each starting with the letter “S,” representing the five steps of the methodology:
- Seiri (Sort): This step involves sorting through all items in the workplace and distinguishing between necessary items and unnecessary ones. Unnecessary items are removed, reducing clutter and streamlining the workspace.
- Seiton (Set in order): After sorting, the next step is to arrange and organize the necessary items in a systematic manner. Everything should have a designated place, and items should be stored in a way that facilitates easy access and retrieval.
- Seiso (Shine): In this step, emphasis is placed on cleanliness and regular maintenance of the workspace. Cleaning activities are performed regularly to ensure that the workspace remains tidy, and free from dirt, dust, and debris. This step also involves inspecting equipment and machinery for any defects or issues that may affect performance.
- Seiketsu (Standardize): Standardization involves establishing and implementing standardized procedures and practices for maintaining the improvements achieved in the previous steps. Standardized processes ensure consistency and efficiency in the workplace, making it easier to sustain the gains achieved through 5S implementation.
- Shitsuke (Sustain): The final step focuses on sustaining the improvements made through ongoing discipline and adherence to the 5S principles. It involves fostering a culture of continuous improvement and accountability among employees, encouraging them to uphold the standards established in the previous steps.
Overall, the 5S System aims to create a clean, organized, and efficient workplace conducive to productivity, safety, and quality. It promotes employee engagement and ownership of the work environment, ultimately leading to improved operational performance and customer satisfaction.
Also Read: 5S: The Five Pillars of a Lean and Productive Workplace
4. Value Stream Mapping
A Brief Overview of Value Stream Mapping
Value Stream Mapping (VSM) is a visual tool used in process improvement to analyze and design the flow of materials and information required to bring a product or service from supplier to customer. It originated from the Lean manufacturing philosophy and is closely associated with the Toyota Production System. VSM provides a holistic view of the entire process, allowing teams to identify value-adding activities that contribute directly to meeting customer needs, as well as non-value-adding activities that create waste and should be minimized or eliminated. By mapping out the current state and designing a future state, organizations can identify opportunities for improvement and implement changes to optimize efficiency and effectiveness.
Activities of Value Stream Mapping and their Application in Root Cause Analysis
- Identifying Value-Enabling Activities: Value Stream Mapping helps distinguish between activities that directly contribute to delivering value to the customer and those that enable value creation. By visually mapping out the entire process flow, including material and information flows, VSM highlights the activities that directly impact product or service quality, lead time, and customer satisfaction. Analyzing these value-enabling activities allows teams to prioritize resources and efforts in areas that have the most significant impact on overall process performance.
- Identifying Value-Adding Activities: Within the process flow depicted in the Value Stream Map, Value-Adding Activities are those steps that directly transform raw materials or inputs into finished products or services that meet customer requirements. By identifying and analyzing these value-added activities, teams can assess the efficiency and effectiveness of each step in the process. This analysis helps pinpoint opportunities for improvement, such as reducing cycle times, eliminating bottlenecks, or optimizing resource utilization, to enhance overall process performance and customer value.
- Identifying Non-Value-Adding Activities: Non-Value-Adding Activities are steps or tasks within the process that do not directly contribute to creating value for the customer and are considered wasteful or unnecessary. These activities often include waiting times, unnecessary transportation, overproduction, excess inventory, and defects or rework. By identifying and categorizing non-value-adding activities on the Value Stream Map, teams can uncover the root causes of process inefficiencies and waste. Root cause analysis techniques, such as the 5 Whys or Fishbone Diagrams, can then be applied to determine the underlying reasons for these non-value-adding activities and develop targeted solutions for improvement.
- Analyzing Process Flow and Relationships: Value Stream Mapping provides a visual representation of the end-to-end process flow, including all interconnected steps, handoffs, and interactions between different stages of the process. Analyzing this process flow helps identify potential sources of variation, delays, or breakdowns in communication or coordination that may contribute to process problems or inefficiencies. By understanding the relationships between different process steps and stakeholders, teams can uncover hidden dependencies or constraints that impact overall process performance and develop strategies to mitigate their effects.
- Facilitating Cross-Functional Collaboration: Value Stream Mapping is often conducted as a cross-functional exercise involving stakeholders from different departments or functions within the organization. This collaborative approach encourages knowledge-sharing, brainstorming, and consensus-building among team members, leading to a more comprehensive understanding of the root causes of process problems. By involving representatives from all relevant areas of the business, teams can leverage diverse perspectives and expertise to identify and address underlying issues more effectively.
The application of Value Stream Mapping in root cause analysis enables organizations to gain valuable insights into their processes, identify areas for improvement, and develop targeted solutions to address underlying issues. By visually depicting the flow of value through the entire process and analyzing the root causes of inefficiencies or problems, teams can drive continuous improvement and enhance overall process performance and customer satisfaction.
Value Stream Mapping is a crucial tool in Six Sigma for analyzing and optimizing processes. Its purpose is to visually represent the flow of materials and information through a process, allowing teams to identify areas of inefficiency and waste. By distinguishing between value-enabling, value-adding, and non-value-adding activities, VSM helps streamline processes, reduce lead times, and enhance overall efficiency.
Also Read: Understanding Value-Added and Non-Value-Added Activities: A comprehensive guide
5. Regression Analysis

Overview of Regression Analysis
Regression analysis is a statistical technique used to model and analyze the relationship between a dependent variable and one or more independent variables. It aims to understand how changes in the independent variables (input) affect the dependent variable (output).
The origins of regression analysis can be traced back to the early 19th century, with the work of Francis Galton, a British mathematician and scientist. However, its systematic development and formalization occurred in the late 19th and early 20th centuries with the pioneering work of Sir Francis Galton, Karl Pearson, and others in the field of statistics.
Types of Regression Analysis
Over time, regression analysis has evolved into various forms, including linear regression, multiple regression, logistic regression, and polynomial regression, among others. It finds applications in various fields such as economics, finance, social sciences, engineering, and biological sciences, where understanding and quantifying relationships between variables are essential for decision-making and prediction.
- Linear Regression: Linear regression is a statistical method used to model the relationship between a dependent variable (usually denoted as 𝑦y) and one or more independent variables (usually denoted as 𝑥x). The relationship is assumed to be linear, meaning that changes in the independent variable(s) result in a proportional change in the dependent variable. The goal of linear regression is to fit a straight line to the data points that best represent the relationship between the variables. It’s commonly used for predicting outcomes based on input variables and understanding the strength and direction of the relationship between variables.
- Multiple Regression: Multiple regression extends linear regression to model the relationship between a dependent variable and two or more independent variables. Instead of fitting a straight line, multiple regression fits a plane (in three dimensions) or a hyperplane (in higher dimensions) to the data points. Multiple regression allows for the analysis of more complex relationships between variables and enables the prediction of outcomes based on multiple predictors simultaneously.
- Logistic Regression: Logistic regression is used when the dependent variable is categorical (i.e., it takes on discrete values such as binary outcomes like “yes” or “no”). Unlike linear regression, which predicts continuous outcomes, logistic regression predicts the probability that a particular outcome will occur. It models the relationship between the independent variables and the log odds of the categorical outcome, using a logistic function (sigmoid curve) to transform the linear combination of predictors into probabilities. Logistic regression is widely used in fields such as medicine, social sciences, and marketing for classification tasks.
- Polynomial Regression: Polynomial regression is an extension of linear regression that allows for non-linear relationships between the dependent and independent variables. Instead of fitting a straight line, polynomial regression fits a curve (typically a polynomial function) to the data points. It involves adding polynomial terms (e.g., quadratic, cubic) to the regression equation to capture the curvature in the relationship. Polynomial regression is useful when the relationship between variables cannot be adequately captured by a linear model and is commonly used in engineering, physics, and economics to model non-linear phenomena.
Activities of Regression Analysis and its Application in Root Cause Analysis
Regression analysis can play a crucial role in root cause analysis by helping to identify and understand the relationships between input variables and output variables in a process or system. Here’s how regression analysis can be applied in root cause analysis:
- Identifying Relationships: Regression analysis allows analysts to identify and quantify the relationships between one or more input variables (independent variables) and an output variable (dependent variable). By analyzing historical data or experimental results, regression models can reveal how changes in the input variables affect the outcome or performance of the process. This insight enables analysts to pinpoint which factors may be contributing to observed variations or problems in the system.
- Detecting Patterns and Trends: Regression analysis helps detect patterns, trends, and correlations in the data that may indicate potential root causes of process problems. By examining the coefficients and significance levels of the regression model’s parameters, analysts can identify which input variables have the most significant impact on the output variable. This information allows them to focus their investigation on those factors that are most likely to be driving the observed variations or issues.
- Quantifying Impact: Regression analysis provides quantitative estimates of the impact of each input variable on the output variable, as measured by the coefficients of the regression model. These coefficients represent the change in the output variable for a one-unit change in the corresponding input variable, holding all other variables constant. By understanding the magnitude and direction of these effects, analysts can prioritize their efforts to address the most influential factors contributing to process problems.
- Diagnosing Residuals: In regression analysis, residuals are the differences between the observed values of the dependent variable and the values predicted by the regression model. Analyzing the residuals can help diagnose potential issues with the model, such as non-linearity, heteroscedasticity, or outliers. By examining patterns in the residuals, analysts can identify areas where the model may be inadequately capturing the relationship between the input and output variables, leading to insights into additional root causes of process problems.
- Model Validation and Prediction: Regression analysis allows analysts to validate the predictive accuracy of the model by comparing its predictions to new or unseen data. By assessing the model’s ability to accurately forecast future outcomes, analysts can gain confidence in its reliability for identifying root causes and guiding decision-making. Additionally, regression models can be used to simulate “what-if” scenarios to evaluate the potential impact of interventions or changes to the input variables on the output variable, aiding in the development of effective root cause solutions.
Regression analysis provides a powerful tool for identifying and understanding the relationships between input and output variables in a process or system. By analyzing historical data or experimental results, quantifying the impact of various factors, and diagnosing model residuals, regression analysis enables analysts to pinpoint the root causes of process problems and develop targeted solutions for improvement.
6. Pareto Chart

A Pareto chart is a graphical tool used for quality control and decision-making that combines both bars and a line graph. It’s based on the Pareto principle, which states that roughly 80% of effects come from 20% of causes.
A Brief Overview of Pareto Chart
Vilfredo Pareto, in the early 20th century, observed this principle while studying wealth distribution, noting that 80% of Italy’s wealth belonged to 20% of the population. Later, the concept was applied to various fields, including quality management and process improvement.
The chart consists of bars representing individual categories or factors, arranged in descending order of frequency or impact. The line graph represents the cumulative percentage of the total. The chart helps prioritize efforts by showing which factors have the greatest cumulative effect.
The Pareto chart serves as a powerful tool in root cause analysis by helping identify and prioritize the most influential factors contributing to a problem. Here’s how it’s applied:
Download the Pareto Chart Template
Activities of Pareto Chart and its Application in Root Cause Analysis
The Pareto chart’s application in root cause analysis enables teams to efficiently identify, prioritize, and address the key factors driving problems or inefficiencies. By focusing efforts on the vital few contributors, organizations can achieve more significant and sustainable improvements in their processes and outcomes. Here’s how the Pareto Chart is applied:
- Identification of Key Contributors: The Pareto chart visually represents the frequency or impact of various factors contributing to a problem. By examining the bars in descending order of frequency or impact, teams can quickly identify the most significant contributors.
- Focus on Vital Few: The Pareto principle suggests that roughly 80% of effects stem from 20% of causes. Therefore, the chart helps distinguish the “vital few” from the “trivial many.” Root cause analysis can then focus efforts on addressing the vital few factors responsible for the majority of issues.
- Prioritization of Actions: Once the key contributors are identified, teams can prioritize corrective actions accordingly. Resources and efforts are directed towards addressing the root causes with the greatest impact, leading to more efficient problem-solving and improvement initiatives.
- Continuous Improvement: Pareto analysis isn’t a one-time activity; it’s part of an ongoing process of continuous improvement. Regular monitoring and analysis using Pareto charts enable organizations to track progress, identify emerging issues, and adjust strategies as needed to maintain performance improvement over time.
The Pareto chart is a powerful tool for identifying and prioritizing the most significant components or factors in a process. By visually displaying the frequency or impact of each category, it helps users focus their efforts on addressing the vital few that have the greatest cumulative effect on the desired outcome.
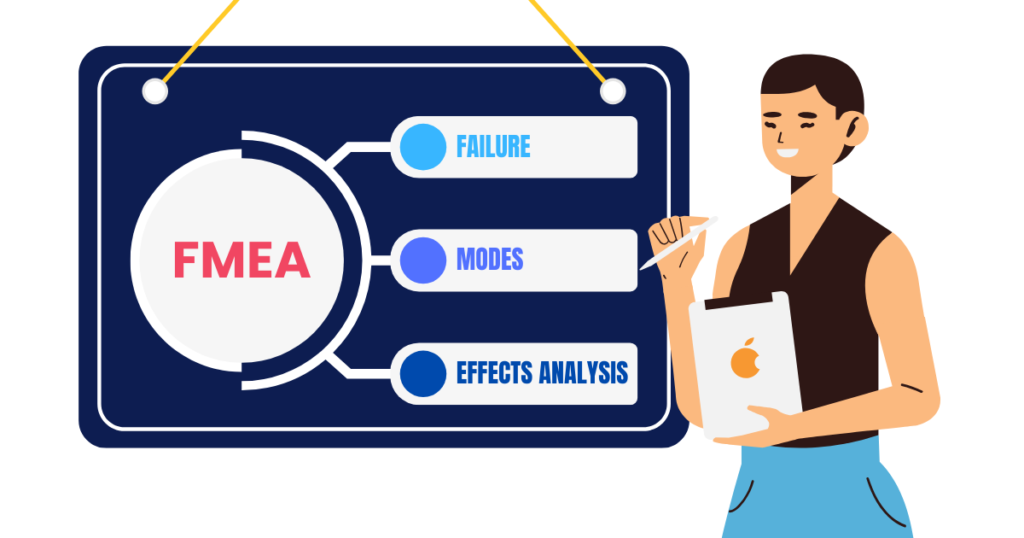
7. FMEA (Failure Modes and Effects Analysis)
Overview of FMEA (Failure Modes and Effects Analysis)
Failure Modes and Effects Analysis (FMEA) is a systematic methodology used to identify and prioritize potential failures within a process, product, or system, as well as their potential effects. It originated in the 1940s within the aerospace and defence industries, particularly during World War II, as a method to improve the reliability and safety of military systems. Since then, FMEA has been widely adopted across various sectors, including automotive, manufacturing, healthcare, and engineering, to prevent and mitigate potential failures that could lead to undesirable consequences.
Enrol in the FMEA course and get certified.
Activities of FMEA (Failure Modes and Effects Analysis) and its Application in Root Cause Analysis
FMEA is applied in root cause analysis to proactively identify and mitigate risks associated with potential failures. It systematically examines each component or step in a process to identify failure modes, assesses their potential effects on the overall process or system, and determines preventive or corrective measures to control or eliminate them. FMEA helps organizations prioritize their response efforts by focusing on high-risk failure modes that pose the greatest threats to process performance, reliability, and customer satisfaction. Through continuous review and updates, FMEA enables organizations to enhance quality, reliability, and safety while minimizing the likelihood of costly failures. Here’s how FMEA contributes to root cause analysis:
- Identification of Potential Failure Modes: FMEA systematically evaluates each component or step within a process to identify potential failure modes. By examining various failure scenarios, FMEA helps uncover the underlying causes of failures that could impact product quality, reliability, or safety.
- Assessment of Potential Effects: Once potential failure modes are identified, FMEA assesses their potential effects on the overall process or system. It quantifies the severity of each potential effect, ranging from minor inconveniences to critical failures that could lead to significant consequences.
- Analysis of Root Causes: FMEA facilitates the analysis of root causes by exploring the factors contributing to each identified failure mode. It considers factors such as design flaws, material defects, human error, environmental conditions, and process variability to determine the underlying causes of failures.
- Prioritization of Risks: FMEA helps prioritize risks by considering the likelihood of occurrence, severity of consequences, and detectability of failure modes. By focusing on high-risk failure modes, organizations can allocate resources effectively to address the most critical root causes and prevent future failures.
- Development of Preventive and Corrective Actions: Based on the analysis of potential failure modes and their root causes, FMEA enables organizations to develop preventive and corrective actions. These actions may include design modifications, process improvements, procedural changes, training initiatives, or enhanced quality control measures aimed at eliminating or mitigating identified risks.
- Continuous Improvement: FMEA supports continuous improvement efforts by providing a systematic framework for identifying, analyzing, and addressing root causes of failures. Organizations can use FMEA results to implement preventive measures, monitor process performance, and refine their risk management strategies over time.
FMEA serves as a proactive risk management tool, enabling organizations to anticipate, analyze, and address potential failure modes before they occur. By systematically identifying and mitigating risks, FMEA helps improve product quality, reliability, and safety, while also reducing costs associated with failures and defects.
Also Read: How to successfully deploy an FMEA root cause analysis?
8. Kaizen
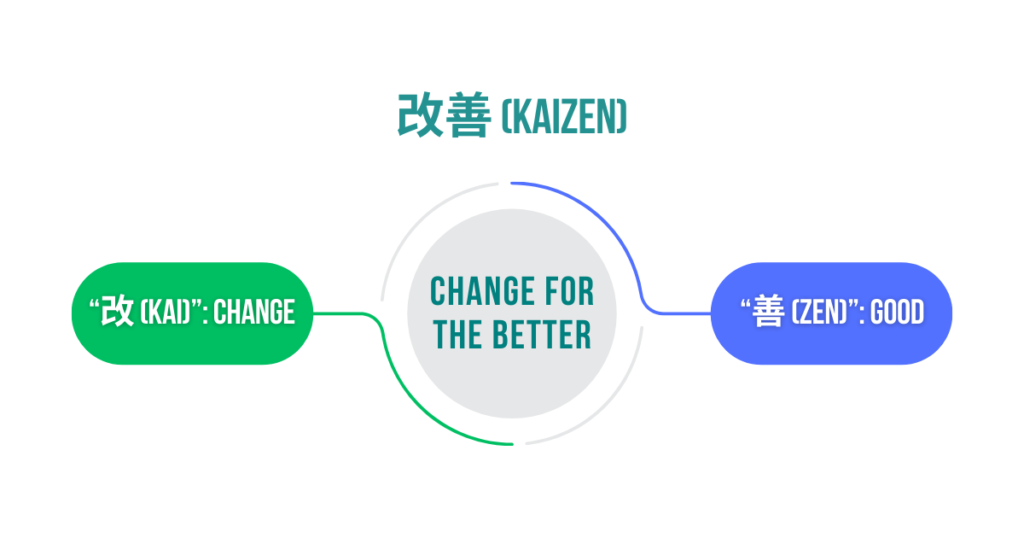
Kaizen, originating from Japan, is a term that translates to “continuous improvement” or “change for the better.” It emerged as a core principle of Japanese business philosophy and management practices, notably popularized by Japanese companies like Toyota.
Overview of Kaizen
Kaizen traces its roots to post-World War II Japan when the country was focused on rebuilding its economy. It was heavily influenced by the concepts of quality management introduced by American experts like W. Edwards Deming and Joseph Juran. Japanese companies, particularly Toyota, embraced these ideas and integrated them into their management systems.
At its core, Kaizen embodies the belief that continuous, incremental improvements are essential for long-term success and competitiveness. Rather than pursuing large-scale, revolutionary changes, Kaizen emphasizes making small, incremental improvements to processes, products, and systems on a daily basis.
Kaizen is not a specific technique or tool but rather a philosophy and mindset that permeates all levels of an organization. It encourages employees at all levels to identify inefficiencies, suggest improvements, and implement changes to enhance quality, efficiency, and productivity.
Some key principles of Kaizen include a focus on customer satisfaction, employee involvement and empowerment, data-driven decision-making, and a commitment to continuous learning and adaptation. It emphasizes teamwork, collaboration, and a problem-solving mindset to drive positive change.
Activities of Kaizen and its Application in Root Cause Analysis
Kaizen has been widely adopted across industries worldwide, not only in manufacturing but also in services, healthcare, and other sectors. It has proven to be particularly effective in environments where innovation, flexibility, and responsiveness are critical for success. Here’s how it applies:
- Problem Identification: Kaizen encourages employees to actively identify problems or inefficiencies in processes, products, or services. By fostering a culture of continuous improvement, Kaizen ensures that even minor issues are brought to light and addressed promptly.
- Root Cause Analysis: Once a problem is identified, Kaizen facilitates root cause analysis to determine the underlying reasons behind it. Teams are encouraged to delve deep into the process to identify not just the symptoms but the fundamental causes of the issue.
- Employee Involvement: Kaizen emphasizes the involvement of frontline employees in root cause analysis. Since they are directly involved in the day-to-day operations, they often possess valuable insights into the root causes of problems. By engaging employees in problem-solving activities, Kaizen ensures that solutions are practical, sustainable, and well-suited to the context.
- Data-Driven Approach: Kaizen promotes a data-driven approach to root cause analysis. Teams collect and analyze relevant data to understand patterns, trends, and correlations related to the problem at hand. This enables them to identify root causes based on empirical evidence rather than speculation.
- Continuous Improvement: The essence of Kaizen lies in its commitment to continuous improvement. Root cause analysis is not seen as a one-time activity but rather an ongoing process. Even after implementing solutions, teams monitor outcomes, gather feedback, and make further refinements to ensure sustained improvement over time.
- Cultural Shift: Implementing Kaizen as a root cause analysis tool often requires a cultural shift within an organization. It involves fostering a mindset of curiosity, openness to feedback, and a willingness to challenge the status quo. Through training, education, and leadership support, organizations can cultivate a culture where root cause analysis becomes ingrained in everyday operations.
Kaizen’s application in root cause analysis goes beyond mere problem-solving; it represents a holistic approach to organizational improvement. By empowering employees, promoting data-driven decision-making, and fostering a culture of continuous improvement, Kaizen enables organizations to identify and address root causes effectively, leading to sustained growth and success.
9. Poka-Yoke
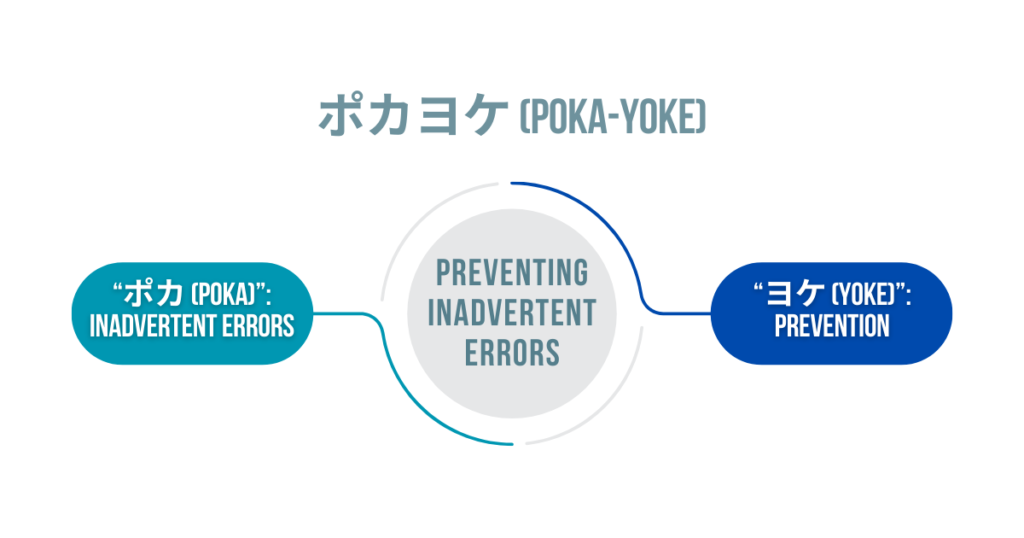
Poka-Yoke is a Japanese term that translates to “mistake-proofing” or “error-proofing.” It refers to techniques or mechanisms designed to prevent errors or mistakes from occurring during the production process. These methods aim to make it impossible or difficult for individuals to make errors, thereby improving product quality and reducing defects.
Overview of Poka-Yoke
Poka-Yoke originated in Japan in the 1960s as part of the Toyota Production System (TPS), which is renowned for its emphasis on continuous improvement and waste reduction. It was developed by Shigeo Shingo, a Japanese industrial engineer and Toyota consultant, who recognized the importance of error prevention in achieving higher levels of efficiency and quality in manufacturing.
The primary purpose of Poka-Yoke is to eliminate defects by addressing the human error factor in production processes. By implementing Poka-Yoke techniques, companies can reduce rework, scrap, and defects, resulting in cost savings and improved customer satisfaction.
Poka-Yoke techniques can take various forms, including physical devices, visual aids, warning signals, and procedural controls. These mechanisms are integrated into the production process to detect and prevent errors at the source, ensuring that products meet quality standards without the need for costly inspections or rework.
Examples of Poka-Yoke devices
- Error-Preventing Jigs: Tools or fixtures that guide assembly workers to perform tasks correctly and in the proper sequence, preventing mistakes.
- Sensor-Based Systems: Automated sensors or detectors that identify deviations from standard processes and trigger alerts or shutdowns to prevent errors.
- Colour-Coded Components: Using colour-coding to differentiate between similar parts or components, reduces the risk of assembly errors.
- Checklists and Job Aids: Providing visual aids or checklists to remind workers of critical steps or procedures, reducing the likelihood of oversight.
Benefits of Poka-Yoke techniques
- Improved Quality: By preventing errors at the source, Poka-Yoke helps maintain consistent quality levels and reduces defects in manufactured products.
- Cost Reduction: Poka-Yoke minimizes the need for rework, scrap, and warranty claims, resulting in cost savings for the organization.
- Enhanced Efficiency: By streamlining processes and eliminating error-related delays, Poka-Yoke improves overall production efficiency and throughput.
- Employee Empowerment: Providing workers with tools and mechanisms to prevent errors empowers them to take ownership of quality and contribute to process improvement efforts.
Activities of Poka-Yoke and its Application in Root Cause Analysis
Poka-Yoke, or mistake-proofing, plays a crucial role in root cause analysis by addressing the underlying issues that lead to errors or defects in the production process. Here’s how Poka-Yoke can be applied in root cause analysis:
- Error Prevention: The primary objective of Poka-Yoke is to prevent errors from occurring in the first place. By implementing error-proofing mechanisms such as physical devices, sensors, or procedural controls, organizations can identify potential sources of errors and eliminate them proactively. This prevents the recurrence of issues and helps in identifying the root causes of errors.
- Data Collection: Poka-Yoke devices and systems often incorporate sensors or detectors that capture data related to process deviations or errors. This data collection allows organizations to analyze patterns and trends, helping them identify common root causes of errors across different processes or production lines.
- Problem Identification: When Poka-Yoke mechanisms detect deviations from standard processes or specifications, they provide immediate feedback or alerts to operators or supervisors. This real-time feedback enables swift identification of problems, allowing teams to investigate and address root causes promptly.
- Continuous Improvement: Poka-Yoke fosters a culture of continuous improvement by encouraging employees to identify and implement error-proofing solutions. As part of root cause analysis, teams can analyze the effectiveness of existing Poka-Yoke measures and identify areas for further improvement. This iterative process helps in addressing root causes systematically and enhancing overall process reliability.
- Documentation and Analysis: Poka-Yoke systems often generate data logs or reports detailing error occurrences, corrective actions taken, and their outcomes. These records serve as valuable sources of information for root cause analysis, allowing teams to track the effectiveness of Poka-Yoke measures over time and identify persistent root causes that require deeper investigation.
- Cross-Functional Collaboration: Root cause analysis often involves collaboration between different departments or teams within an organization. Poka-Yoke provides a common framework and language for discussing errors and implementing solutions, facilitating cross-functional collaboration in identifying and addressing root causes effectively.
Poka-Yoke serves as a proactive tool in root cause analysis by preventing errors, collecting data, facilitating problem identification, fostering continuous improvement, and enabling cross-functional collaboration. By integrating Poka-Yoke principles into root cause analysis processes, organizations can enhance their quality management practices and drive sustained process improvement.
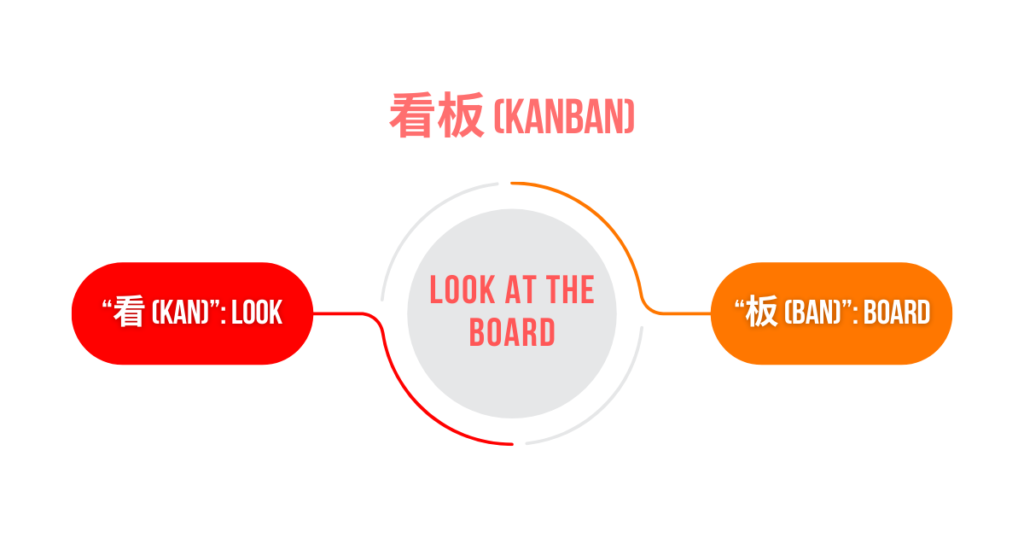
10. Kanban System
The Kanban system is a lean manufacturing technique originating from Japan, renowned for its effectiveness in inventory management and cost reduction.
Overview of the Kanban System
The Kanban system was developed by Toyota in the 1940s and 1950s as part of the Toyota Production System (TPS), also known as Lean manufacturing. Its name, “Kanban,” comes from the Japanese words “kan” (visual) and “ban” (card or board), reflecting its visual nature.
Key Principles of the Kanban System
- Visual Management: The Kanban system visually represents workflow stages, tasks, or inventory items using cards, boards, or signals.
- Pull-Based System: Work or production is initiated based on actual demand signals from downstream processes or customers, rather than forecasts or schedules.
- Work-in-Progress (WIP) Limiting: Kanban limits the amount of work in progress at each stage of production or supply chain, preventing overburdening of resources and minimizing bottlenecks.
- Continuous Improvement: Kanban encourages continuous improvement by enabling teams to identify and address inefficiencies in workflow processes.
Components of Kanban
- Kanban Cards or Signals: These represent tasks, items, or orders and convey information about work status, priority, and requirements.
- Kanban Board: A visual display of workflow stages, with columns representing different stages of production or process flow. Kanban cards move through the board as work progresses.
- WIP Limits: Each column on the Kanban board has a WIP limit, specifying the maximum number of items allowed in that stage. This prevents overloading and helps maintain a smooth flow of work.
Benefits of Kanban
- Improved Workflow Visibility: Kanban provides a clear, visual representation of the workflow, making it easier to identify bottlenecks, inefficiencies, and opportunities for improvement.
- Efficiency and Productivity: By limiting WIP and focusing on completing tasks based on demand, Kanban helps optimize resource utilization and reduce idle time, leading to improved efficiency and productivity.
- Flexibility and Adaptability: Kanban’s pull-based nature allows for quick adjustments to changing priorities, customer demands, and production requirements, enhancing organizational flexibility and responsiveness.
- Reduced Lead Times: With WIP limits and a focus on continuous flow, Kanban minimizes lead times, enabling faster delivery of products or services to customers.
- Empowered Teams: Kanban promotes collaboration, accountability, and problem-solving among team members, empowering them to take ownership of their work and drive continuous improvement.
Activities of the Kanban System and its Application in Root Cause Analysis
The Kanban system, while primarily known for its role in managing workflow and inventory, also plays a significant role in root cause analysis. Here’s how it applies to identifying and addressing underlying issues:
- Visualization of Workflow: The Kanban system visualizes the workflow by using cards or signals to represent different stages of production or inventory replenishment. Each stage has a predetermined maximum capacity, ensuring that work is only initiated when there is available capacity downstream.
- Inventory Control: Kanban cards or signals are used to control inventory levels effectively. When inventory reaches a predefined minimum level, it triggers a signal to replenish or produce more items. This just-in-time approach ensures that inventory levels are optimized, minimizing excess inventory holding costs while preventing stockouts.
- Pull-Based System: The Kanban system operates on a pull-based principle, where production or replenishment is initiated based on actual demand from downstream processes or customers. This eliminates overproduction and reduces the risk of excess inventory buildup, leading to significant cost savings.
- Limiting Work in Progress (WIP): Kanban limits the amount of work in progress at each stage of production or supply chain, preventing bottlenecks and overburdening of resources. By maintaining optimal WIP levels, organizations can improve workflow efficiency, reduce lead times, and enhance overall productivity.
- Cumulative Flow Diagrams: Kanban systems often utilize cumulative flow diagrams to track the flow of work items over time. These diagrams provide a historical view of workflow performance, including cycle times, throughput, and work distribution across stages. Anomalies or patterns in the cumulative flow can signal underlying issues that need further investigation and root cause analysis.
- Daily Stand-up Meetings: Regular stand-up meetings, a common practice in Kanban, provide an opportunity for team members to discuss any issues or challenges encountered during the workflow. These meetings serve as a forum for identifying potential root causes of problems and collaboratively brainstorming solutions. By addressing issues early and proactively, teams can prevent them from escalating into larger problems.
- Continuous Improvement: The Kanban system encourages continuous improvement through regular review and optimization of workflow processes. Teams analyze Kanban metrics, such as cycle time and throughput, to identify areas for improvement and implement corrective actions. This iterative approach drives ongoing efficiency gains and cost reductions.
- Supplier Integration: Kanban extends beyond internal processes to include external suppliers in the inventory management system. Suppliers receive Kanban signals indicating when to deliver raw materials or components, aligning supply with actual demand and minimizing inventory holding costs across the entire supply chain.
- Adaptability and Flexibility: The Kanban system is highly adaptable to changing demand patterns and production requirements. As demand fluctuates, Kanban signals dynamically adjust production or replenishment schedules, ensuring that resources are allocated efficiently and cost-effectively.
- Employee Empowerment: Kanban empowers employees at all levels to actively participate in inventory management and process improvement initiatives. Teams are encouraged to identify and resolve bottlenecks, streamline workflows, and suggest innovations, fostering a culture of continuous improvement and cost-consciousness.
The Kanban system serves as a valuable tool for root cause analysis by providing visibility into the workflow, identifying abnormalities, facilitating collaboration among team members, and promoting a culture of continuous improvement. By leveraging Kanban’s visual management principles and iterative approach, organizations can effectively diagnose and resolve the root causes of problems to optimize their workflow and achieve greater efficiency.
In Conclusion
The 10 powerful Six Sigma tools and techniques discussed in this guide offer invaluable resources for organizations striving to enhance their business processes. By briefly recapping each tool and its significance, we reinforce the importance of incorporating these methodologies into business process improvement efforts:
- DMAIC and DMADV: These structured approaches provide systematic frameworks for process improvement and new process development, respectively, ensuring organizations can continuously refine their operations.
- The 5 Whys: By delving deep into the root causes of problems, the 5 Whys method enables teams to address underlying issues rather than just symptoms, fostering long-term solutions.
- The 5S System: With its emphasis on workplace organization and standardization, the 5S System promotes efficiency, safety, and quality by eliminating waste and optimizing workflow.
- Value Stream Mapping: This tool offers insights into the flow of materials and information within processes, enabling organizations to identify value-adding activities and eliminate non-value-adding ones.
- Regression Analysis: By analyzing relationships between variables, regression analysis helps organizations understand the factors influencing their processes and make data-driven decisions for improvement.
- Pareto Chart: By highlighting the vital few factors contributing to process issues, Pareto charts guide organizations in prioritizing improvement efforts for maximum impact.
- FMEA (Failure Modes and Effects Analysis): FMEA aids organizations in proactively identifying and mitigating potential failure modes, minimizing risks, and enhancing product and process quality.
- Kaizen: Through continuous improvement and employee involvement, Kaizen fosters a culture of innovation, driving incremental enhancements in processes and products.
- Poka-Yoke: By designing fail-safe mechanisms, Poka-Yoke prevents errors and defects in production processes, ensuring high levels of quality and reliability.
- Kanban System: With its focus on visual management and just-in-time inventory control, the Kanban system streamlines workflows, reduces waste, and improves overall efficiency.
Incorporating these tools and techniques into business process improvement efforts is essential for organizations looking to achieve excellence, enhance customer satisfaction, and drive sustainable growth. By leveraging the power of Six Sigma methodologies, organizations can systematically identify areas for improvement, implement effective solutions, and continuously refine their processes to achieve operational excellence.