
Table of Contents
FMEA stands for Failure, Modes, Effects, and Analysis, and is an extremely powerful tool that is often deployed for the purposes of Root Cause Analysis. This root cause analysis can be either proactive or reactive, for the purpose of analyzing current state processes or future solutions, a temporary project-based document or a continuously LIVE aid. FMEA has a lot going for it, but in doing so, FMEA is a complex tool which can require a lot of explaining. That is why we are here…
What is FMEA?
As mentioned, the Failure Modes Effects Analysis tool is one that sits firmly in the root cause analysis camp. It is a tool used by professionals to logically identify:
- The activity in question (process step, solution etc.)
- How the input has gone wrong.
- The impact on the outputs of the activity.
- Potential causes.
- Current controls in place.
- Actions proposed to mitigate and stop this issue.
- Actions taken to mitigate and stop this issue.
- Risk and probability scores are associated with each of these.
The main purpose of the FMEA revolves around risk. The identification of risk, the mitigation of risk and the removal of it. Risk is both seen today in your current processes/activities, but also the potential risk that could arise from solutions deployed or changes made, to future processes built out or endeavours followed.
With the FMEA, you need to work methodically through each of the aforementioned steps to assess the risks as you work through. You start of with risk being at one level, identify potential actions to deploy and actions actually deployed, and then identify your new risk level. This methodical approach enables you to test a range of scenarios, potential controls and solutions to see which approach would work best.
The ultimate aim of the FMEA is therefore to reduce risk, identify the best possible solution that does this and ensure the actions identified within the FMEA are indeed delivered.
Breakdown of the FMEA tool
To work methodically through this tool, you need a good understanding of what each stage actually requires. Let’s break this down:
(Disclaimer: The titles used for each section and language used can differ depending on who created the FMEA template. This is nothing to worry about) [Download FMEA Breakdown PDF]
1. Process step/activity
What is the process step under investigation? At this stage we are identifying the process step or activity we are investigating. This is the activity we want to understand the risk around, the controls needed and recommended actions. If you are using your FMEA to look at future risk or solutions, this would be your solution. This step will need to be a specific step (not an overall process) and will need to identify an activity where something HAS or COULD go wrong.
Good examples of a “process step” would include:
- Upload the Insurance Report into the system.
- Sign off the final budget.
- Run monthly Facilities Management meetings.
- Check variances in pay rates.
- Chase supplier X for this month’s invoice.
2. Potential failure mode
In what way does this key input go wrong? Here we want to identify how the process step or activity is going or could go wrong. Often, if we have identified a problem, this “mode” is the indicator which highlights that something has indeed gone wrong. For failure modes, there could be more than one way for your process step to go wrong (and there probably is) therefore document as many as you need (across separate lines in the FMEA diagram, not all in one box!).
Good examples of a “potential failure mode” would include:
- The wrong supplier was contacted.
- The water is too warm.
- The report did not sync up with the system.
- Email notification not sent.
- Power to the factory line was interrupted.
3. Potential failure effect(s)
What is the impact of key output variables? Here we need to understand the impact the potential failure could have on the process or the wider business. Specifically, we need to think through how the failure will impact the output from our identified process step. This is where we would consider impact analysis – what is the impact, how big could it be, and what is its extent? Any and all potential impacts, no matter how big or small you perceive them to be now, should be documented.
Good examples of a “potential failure effect(s) would include:
- Staff are not paid/are paid incorrectly.
- There is a delay in receiving the report.
- The customer receives a defective product.
- The item was sent to the wrong address.
- Agent’s workload is increasing through rework.
RATING: Severity
The first rating you need to give is around severity. This score is all about identifying how severe the risk this potential failure poses to the customer/end-user of the process. This depends on critical factors seen as important by the customer or business including cost, reputation, health & safety etc. To score this, 1 indicates there is no impact at all and 10 would indicate a critical impact, with critical factors now being severely impacted.
4. Potential causes
What causes key inputs to go wrong? At this stage, we can now start to root cause the potential failure. Here, you can document all of the potential reasons why a failure would occur (or is), meaning you could use up a lot of rows within your FMEA. To conduct this step, it may be wise to leverage your SMEs who are closer to the process to ensure no potential root cause is left off the table.
Good examples of “potential causes” would include:
- Staff lack an appropriate amount of knowledge.
- System breakdown.
- The appropriate handover was not given after the contact left the business.
- Change in the process is not effectively communicated out.
- Wrong data was added to the system.
RATING: Occurrence
Occurrence refers to identifying how likely this failure is to occur. How likely, and how frequently would we see this failure? To understand this, you may need to look back at how frequently this has happened in the past and, adding in your new potential risks surrounding this failure, score accordingly. To score this, 1 would indicate there is no chance this failure would occur, and 10 would indicate this failure is going to occur, and occur regularly.
Join our FMEA Training Program
5. Current controls
What existing controls are in place? These controls refer to those which stop the problem from occurring and enable the problem to be detected. Here we need to think about what already exists so we don’t seek to replicate this when solving at the end of the tool. It may be the case that the current controls are not strong enough, are not fit for purpose or just have not been applied in the first place.
Good examples of “current controls” would include:
- A process checklist is in place.
- Data is checked by several parties before submission.
- Robust training in place.
- The system has automated data & quality checks in place.
- The process has 3 sign-offs before completion.
RATING: Detection
Detection looks at how likely it is that a potential failure will be detected before it has become a problem. This would be about identifying what could go wrong, not necessarily what has gone wrong. If something has indeed already gone wrong, how easy was this to detect? To score this, 1 would indicate you are certain you would identify the potential failure and cause almost instantly. At 10, it is very unlikely you will discover the failure before it has become a bigger problem.
RATING: RPN
Now you have 3 numbers associated with your ratings, it is time to work out your RPN. RPN stands for risk priority number. This number enables you to line up your potential failures on a risk scale to show which of the potential failures pose the biggest risk currently, and which pose the least amount of risk. The number enables you to balance the 3 types of risks equally (severity, occurrence, detection) and come up with a reasoned number, taking everything into consideration.
6. To calculate your RPN
Severity rating X Occurrence rating X Detection rating. Just time the three numbers together to give you your current RPN.
Recommended action(s)
What are the actions for reducing the occurrence of the cause, or improving detection? Whilst usually added together, you can seek to tackle occurrence and detection separately, depending on your needs. If one score is already quite good compared to the other, focus on the worse score. At this stage of building out your FMEA, you would have taken a pause to think about what comes next. Here, you would most likely run a workshop to review the failure, impact and cause of your highest RPNs and come up with your actions.
Good examples of “recommended action(s)” for reducing the occurrence of the cause/failure would include:
- Improve the training given on the process.
- Add in a double-check on the data.
- Give the process an owner.
- Build out a RACI and share.
For improving detection:
- A notification is sent out from the system.
- A red flag highlights issues on the report.
- A double-check is added.
- A checklist is to be completed at the end of the process.
7. Responsible
When it comes to responsibility, we are talking about who is responsible for ensuring the identified actions are completed. This person will need to ensure the action is completed, the outcome is recorded and that any mitigating actions are identified and further actioned. You need to ensure this person is aware of their responsibility, understands what it entails and is closely associated with the given process.
Good examples of a “responsible” person would include:
- Mark Anderson.
- Head of Procurement.
- Director of Payroll.
- Kelly White – Payroll Analyst.
- Adeel Raman – Technical Support Team.
Don’t be vague when it comes to identifying your responsible people – be specific.
8. Action results
What actions have been completed? At this stage, you can now identify what actions (if any) have been deployed. These actions would be based on the recommended actions identified earlier on in your FMEA, but it may be the case they were not followed or the approach was tweaked or adapted in some way.
Good examples of “recommended action(s) would include:
- Improved the training given on the process.
- Added in a double-check on the data.
- Gave the process an owner.
- Built out a RACI and share.
For improving detection:
- A notification is now sent out from the system.
- A red flag highlights issues on the report.
- A double-check has been added.
- A checklist is now completed at the end of the process.
RATING: FINAL RPN
At this stage, you need to evaluate whether or not the changes you have made have indeed had an impact. You therefore need to calculate a new RPN. Here you will complete a new raying for your severity, occurrence and detection categories, based on the changes that have been deployed. Where does your process now stack up in terms of these indicators? With these new figures, calculate your new RPN. How much have the changes impacted your overall score? Is there potentially more work to be done here? If you have given several potential solutions or recommended actions (as you are looking at future potential failures) does one solution deliver bigger reductions in the original RPN than the others?
You can now rank your FMEA by realised RPN to see which areas still need more work and which you can confidently close off as completed, with risk vastly reduced.
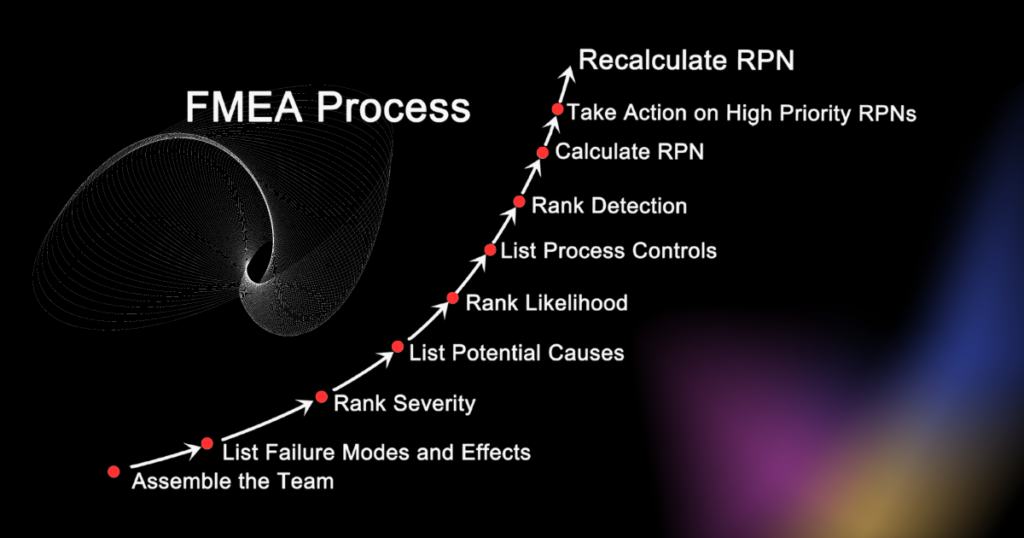
The process of building an FMEA tool
Conducting an FMEA is not as simple as just populating out the template. There is more to it than that, and there are 9 key steps you need to follow to ensure the planning, building and deployment of your FMEA is successful.
- Identify the process. Clearly define the process in question, acknowledging any problems or failures occurring within the process currently. Set the scene – are you looking at actual problems and failures or potential ones?
- Gather the right team. Ensure the right people – those with knowledge of the process in question – are going to be involved in this effort.
- Train out the tool. Given its complexity, ensure those involved in this work know what the tool is, how it will be built and how it will be deployed.
- Break the process down. Break it down into its constituent parts, preferably using a process map or SOP(standard operating procedure) if available, enabling you to pull the individual activities and process steps into your FMEA’s first column right away.
- Impact & effects analysis. Work through, with your team, to understand the impact and effects the potential failures could have on your process (flip the tense if you are dealing with actual problems).
- Identify the cause. Root cause with your team each actual or potential failure, identifying the range of potential causes associated with each individual process step/activity.
- Identify current controls. As a team, identify what controls are currently in place for these failure modes, discussing openly whether or not the controls that should be in place are actually ever adhered to, and if so, how.
- Take action. Based on the recommendations in the FMEA, pause the use of the document for now and deploy your recommended actions. This will include deploying those actions to mitigate the risk, improve/deploy your controls and improve detectability.
- Implement and review. Once action has been taken, close out the implementation of your activities and review where you are. Complete your FMEA’s final RPN score, and assess if more work needs to be done, where efforts now need to be focused or if you can close out the FMEA altogether.
5 benefits of the FMEA
- It can be both reactive and proactive. Not all root cause analysis tools can do this, but the FMEA can. If you want to reduce risk in your current processes or address the failures happening right now, the FMEA enables you to do just this. If you are planning to launch new products and services, design new processes or make sweeping changes to your current state and want to test the risk around all of this, the FMEA enables you to do this.
- It can be kept as a LIVE document. Even post any small or large-scale projects, you can continue to use the FMEA as a control measure within itself, amending the controls and the RPN numbers as required when processes and controls change.
- It is a logical tool. This approach guarantees you’ll leave no stone unturned, identifying what’s gone wrong, how, effects and what is needed to rectify the situation.
- Can be used more widely than just root cause analysis. It can also be deployed in continuous, process and business improvement, to improve proposed solutions, newly designed processes or current operations.
- It is limitless. There is no end to how many rows you can add to your FMEA, how many scenarios you can run through or what potential root causes you can explore. Therefore, it is a tool that can be utilised by everyone, from each department, at any time.
3 drawbacks of the FMEA
- Potential lack of focus. Given the fact the tool can be limitless, it could take you down rabbit holes and make the team lose focus on what they should be targeting.
- Can involve too much work. Given the limitless nature, it can sometimes be off-putting for some to complete an FMEA. If they know they may need to identify 5 potential root causes for 20 steps, plus controls and solutions, it could seem quite daunting.
- Focus on the singular element. Sometimes, this means we focus completely on the root cause and controls for that singular element, not taking into account the wider process it sits within.
Conclusion
The FMEA was first deployed in the 1940s by the US military and has now been more widely deployed in Services companies, Manufacturing, Production and Construction. It can be deployed for projects large and small, to root cause and reduce errors, improve processes and identify controls. It can be used reactively or proactively, can be kept as a LIVE document as a control measure or used project by project, focusing on its use. Whichever industry you are in, and however you decide to use the FMEA it is clear – the tool is highly effective at root-causing failures, identifying impacts and deploying controls.