

Table of Contents
Welcome to the world of problem-solving mastery! At the heart of our quest lies root cause analysis, a crucial tool in untangling the complexities of everyday challenges. Root cause analysis has been a trusted method for centuries, evolving to meet the demands of modern problem-solving.
One such tool is the cause and effect diagram, also known as the fishbone diagram. Developed by Kaoru Ishikawa, this diagram provides a clear and structured way to identify the underlying causes of a problem. Despite its simplicity, it’s a powerful instrument for uncovering hidden connections and guiding effective solutions.
Join us on this journey as we delve into the world of root cause analysis through the lens of cause and effect diagrams. Together, we’ll explore how this tool can revolutionize problem-solving and drive meaningful change.
Understanding the Fishbone Diagram
Definition of Cause and Effect Fishbone Diagram: Cause and Effect Diagrams, also known as fishbone diagrams or Ishikawa diagrams, are visual tools used to explore the relationship between a quality characteristic (effect) and its potential causes. They provide a structured framework for identifying and analyzing the root causes of problems.
Purpose and Importance: Cause and Effect Diagrams play a crucial role in root cause analysis by helping teams uncover the underlying factors contributing to a problem. By visually mapping out possible causes, these diagrams facilitate a deeper understanding of complex issues and guide effective problem-solving strategies.
Alternative Names: Cause and Effect Diagrams are known by various names, including fishbone diagrams and Ishikawa diagrams. These alternative terms reflect the shape of the diagram (resembling a fishbone) and its origin from Kaoru Ishikawa, a renowned quality management expert.
Types and Examples of Fishbone Diagram
Types of Fishbone Diagrams:
Fishbone Diagram Diagrams come in various types tailored to specific problem-solving needs:
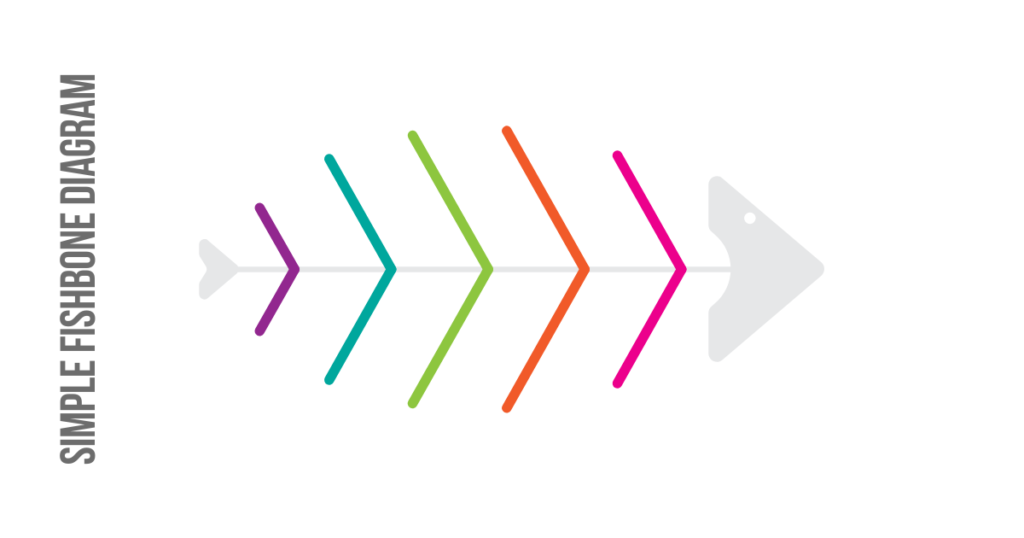
- Simple Fishbone Diagrams: These diagrams offer a straightforward approach without predefined categories, providing flexibility in identifying causes based on the specific problem at hand.
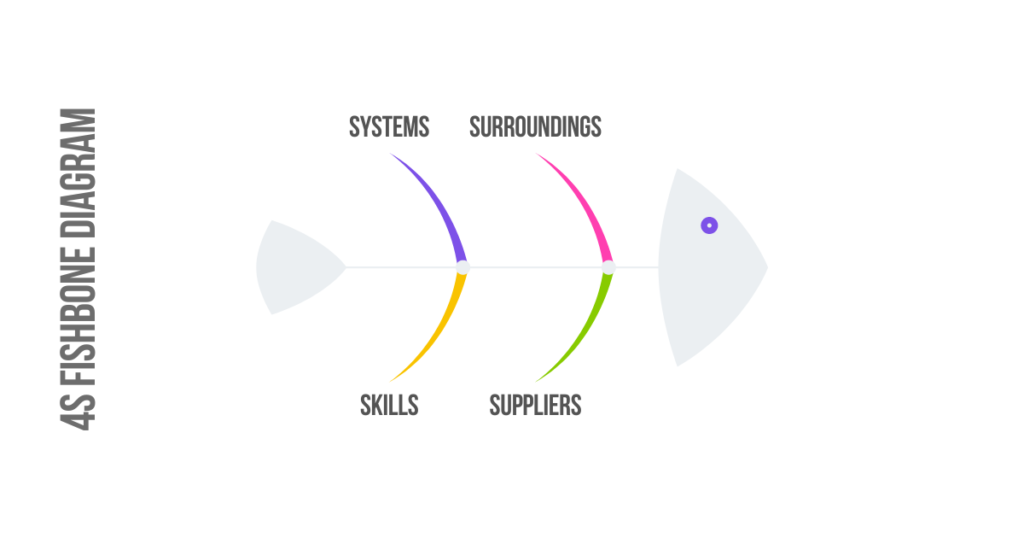
- 4S Fishbone Diagrams: Organized around the categories of systems, surroundings, skills, and suppliers, these diagrams are particularly useful in service industries for analyzing problems related to customer feedback, service quality, and supplier issues.
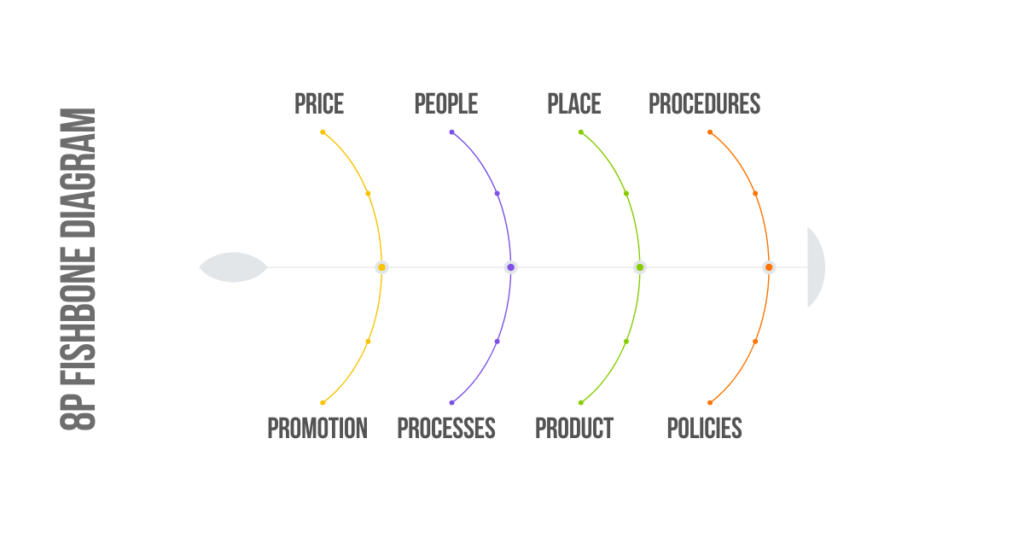
- 8P Fishbone Diagrams: These diagrams classify causes into eight groups: physical evidence, personnel, place, product (service), price, promotion, process, and productivity/quality. They are commonly employed in service, manufacturing, and administrative functions to address complex problems spanning various aspects of operations.
Cause and effect fishbone diagram example:
Cause and Effect Diagrams find application in diverse scenarios:
- Product Development: In product development projects, cause and effect diagrams help identify market opportunities and address issues with current offerings. By thoroughly exploring target customers’ problems and potential causes, organizations can ensure their new products effectively address market needs.
- Troubleshooting Processes: When workflows or processes fail to produce desired outcomes, cause and effect diagrams aid in diagnosing underlying issues. By examining potential causes across different facets of the process, teams can pinpoint areas of improvement and implement targeted solutions.
- Root Cause Analysis: Cause and effect diagrams are instrumental in root cause analysis, enabling organizations to investigate the underlying causes of problems. By identifying root causes rather than treating surface-level symptoms, businesses can implement sustainable solutions to prevent recurrence and enhance overall process efficiency.
Related: 15+ Fishbone Diagram Examples for Brainstorming Problem Causes
Enrol in Root Cause Analysis: Fishbone Diagram Certification Course and get certified.
Benefits and Advantages of Cause and Effect Fishbone Diagram
Benefits of Cause and Effect Diagrams: Cause and Effect Diagrams offer several advantages:
- Identifying Potential Causes: By systematically exploring all possible causes of a problem, these diagrams help teams uncover underlying issues that may not be immediately apparent. This comprehensive approach ensures that no potential cause is overlooked, leading to more effective problem-solving.
- Revealing Weaknesses in Processes: Cause and Effect Diagrams provide a structured framework for analyzing processes, enabling teams to identify weaknesses or bottlenecks that may be contributing to the problem. By visually mapping out causal relationships, organizations can pinpoint areas for improvement and optimize their operations.
- Accelerating Problem-Solving: The visual format of cause and effect diagrams facilitates faster problem-solving by organizing information in a clear and logical manner. Teams can quickly brainstorm and evaluate potential causes, leading to more efficient root cause analysis and solution development.
Visual Representation: Cause and Effect Diagrams offer a visual representation of complex problems and their underlying causes. This visual format enhances understanding and communication among team members, making it easier to collaborate and share insights. By visually organizing causes into categories and subcategories, these diagrams provide a clear overview of the problem landscape, helping teams focus their efforts on areas of greatest impact.
How to Create a Fishbone/Ishikawa Diagram
Creating a cause and effect diagram involves the following steps:
- Pinpoint the Problem or Goal: Identify the specific problem you want to address or the goal you aim to achieve.
- Write the Effect and Draw the Backbone: Write the problem or goal (effect) on the right-hand side of the diagram. Draw a horizontal line extending from the effect to serve as the backbone.
- Select Categories for Causes: Choose categories that represent potential causes of the problem or factors influencing the goal. Common categories include the 4Ms (Methods, Machines, Materials, Manpower) and additional factors like Environment and Management.
- Brainstorm Detailed Causes: For each main category, brainstorm specific causes or factors that could contribute to the problem or goal. Write these causes as branches extending from the main categories.
- Continuously Expand Branches: Delve deeper into each cause by asking “why” or “how” to identify underlying factors. Continue expanding branches until all possible causes are captured.
Related: The process to build a Cause & Effect Diagram
Tips for Effective Cause and Effect Diagram Construction:
- Involve Stakeholders: Collaborate with relevant stakeholders to ensure a comprehensive understanding of the problem and gather diverse perspectives.
- Use Predefined Categories: Consider using predefined categories, such as the 4Ms, to structure the diagram and guide brainstorming sessions.
- Continuously Refine the Diagram: Regularly revisit and refine the cause and effect diagram as new information becomes available or as the problem-solving process progresses. This iterative approach ensures that the diagram remains accurate and up to date.
Related: How to Create a Fishbone Diagram?
Challenges and Analysis of a Fishbone/Ishikawa Diagram
Analyzing Completed Cause and Effect Diagrams:
Analyzing completed cause and effect diagrams can present several challenges in identifying the true root cause of the problem. Some of these challenges include:
- Complexity: Cause and effect diagrams may become intricate, with numerous interconnected causes, making it difficult to discern the primary underlying cause.
- Overlapping Causes: Causes may overlap across different categories, leading to ambiguity in determining their significance.
- Subjectivity: Interpretation of causes may vary among stakeholders, resulting in differing opinions on the root cause.
- Limited Data: Incomplete or insufficient data may hinder the thorough analysis of causes, leaving gaps in understanding.
Strategies for Analysis:
To overcome these challenges and effectively analyze cause and effect diagrams, consider the following strategies:
- Look for Recurring Causes: Identify causes that appear frequently or across multiple categories, as these may indicate a central underlying issue.
- Group Consensus Methods: Use group discussions or consensus-building techniques to prioritize causes and reach agreement on the most probable root cause.
- Data Validation: Validate causes with empirical data or evidence where possible to substantiate their significance and impact.
- Expert Input: Seek input from subject matter experts or individuals with relevant experience to gain insights into complex causes and their implications.
- Iterative Review: Continuously review and refine the analysis of cause and effect diagrams, iterating as new information emerges or the problem-solving process evolves.
Software Solutions for Fishbone Diagram
Recommended Software:
When it comes to creating cause and effect diagrams efficiently, specialized software solutions like SPC for Excel offer valuable tools and features. SPC for Excel enables users to design comprehensive cause and effect diagrams directly within Excel, providing a familiar interface for seamless integration into existing workflows.
Benefits of Software:
Using specialized software for cause and effect diagrams offers several benefits:
- User-Friendly Interface: Software solutions like SPC for Excel feature intuitive interfaces that make it easy for users to create, customize, and analyze cause and effect diagrams without extensive training or technical expertise.
- Extensive Image Libraries: These software solutions often come equipped with extensive image libraries, including a wide range of topic images, icons, and symbols, allowing users to enhance their diagrams with visually engaging elements.
- Seamless Integration: With seamless integration into popular productivity tools like Excel, users can leverage the full capabilities of cause and effect diagram software within familiar environments, streamlining their workflow and maximizing efficiency.
- Collaboration Capabilities: Many software solutions offer collaboration features that enable teams to work together on cause and effect diagrams in real-time, facilitating communication, sharing of ideas, and collective problem-solving efforts.
- Enhanced Analysis Tools: Advanced software solutions may also include built-in analysis tools and functionalities that help users analyze and interpret cause and effect diagrams more effectively, leading to more informed decision-making and problem-solving outcomes.
Related: 10 Free Fishbone Diagram Makers for Collaborative Problem Solving
Conclusion:
Cause and effect diagrams, also known as fishbone or Ishikawa diagrams, are powerful tools for root cause analysis and problem-solving. Throughout this blog, we’ve explored the various aspects of cause and effect diagrams, from their definition and types to their benefits and creation process.
Mastering root cause analysis through cause and effect diagrams is essential for identifying underlying causes, revealing process weaknesses, and accelerating problem-solving efforts. By visually mapping out the relationships between different factors and potential causes, organizations can gain valuable insights into complex problems and develop targeted solutions to address them effectively.
As you continue your journey in problem-solving and quality improvement, I encourage you to apply the knowledge gained from this blog to your respective fields. Whether you’re in manufacturing, healthcare, service industries, or any other sector, cause and effect diagrams can be invaluable assets in your toolkit for driving continuous improvement and achieving success.
Remember, effective problem-solving requires thorough analysis, collaboration, and a commitment to identifying and addressing root causes. By harnessing the power of cause and effect diagrams, you can unlock new opportunities for improvement and make meaningful strides towards excellence in your endeavors.