Risk Priority Number (RPN) & SOD Model (Weighted RPN) Calculator
FMEA: Failure, Modes, Effects, Analysis | Certification Course
Buy Now for $13.99
Udemy prices may vary depending on applied coupons and promotional events.
- 🧑🏫 29 lectures
- ⌚ 2h 3m total length
- 🗃️ 6 downloadable resources
- 📜 Certificate of completion
- 👩🎓 12,634 students
- ⭐ 4.7 rating by 482 students
We offer a detailed breakdown of RPN in our highest-rated Failure Modes and Effects Analysis (FMEA) course on Udemy. If you're interested in exploring other tools within the FMEA methodology, consider enrolling in our course.

Table of Contents
Introduction to FMEA and RPN
Failure Mode and Effects Analysis (FMEA) is one of the most widely used tools for risk management in industries worldwide. It originated in the 1940s during World War II when the U.S. military employed it to systematically analyze potential failure modes in systems. Since then, FMEA has evolved into a cornerstone for quality assurance and process reliability across various sectors, including aerospace, healthcare, automotive, and manufacturing.
At its core, FMEA is a structured approach used to identify, evaluate, and mitigate potential failures in products, processes, or systems. Think of it as a detective working behind the scenes to uncover hidden risks before they can create issues. By proactively addressing these risks, organizations can ensure safety, improve product quality, and reduce costly disruptions. As the saying goes, “Prevention is better than cure”—this perfectly encapsulates the spirit of FMEA.
What is the Risk Priority Number (RPN)?
One key component of FMEA is the Risk Priority Number (RPN), a numerical value that helps prioritize risks. RPN is calculated by multiplying three factors: Severity (S), Occurrence (O), and Detection (D). Each factor is scored on a predefined scale (typically 1 to 10), and the resulting RPN highlights which failure modes require immediate attention.
For example, imagine a manufacturing process where the risk of a defective car brake system is analyzed:
- Severity (impact on safety): 9/10
- Occurrence (likelihood of failure): 7/10
- Detection (ability to identify failure): 6/10
The RPN for this failure mode would be:
RPN = 9 × 7 × 6 = 378
This score signifies a high-priority risk that must be addressed immediately. In this way, RPN acts as a decision-making compass, pointing teams toward the most critical areas requiring mitigation efforts.
How RPN Integrates into FMEA
The RPN is seamlessly woven into the FMEA process. Here’s how it works step-by-step:
- Identify Failure Modes: Teams brainstorm potential ways a product or process could fail.
- Analyze Causes and Effects: The consequences of each failure mode are assessed.
- Rate Severity, Occurrence, and Detection: Based on agreed-upon scales, the team assigns scores for each factor.
- Calculate RPN: By multiplying S × O × D, the RPN for each failure mode is determined.
- Prioritize Risks: High RPN values indicate urgent risks, guiding the team to prioritize corrective actions.
By providing a structured and quantitative assessment, RPN ensures that resources are directed toward addressing the most critical risks first.
Importance of Prioritizing Risks Effectively
In high-stakes industries such as aerospace, healthcare, and automotive, effective risk prioritization can mean the difference between success and disaster. A malfunction in an airplane system or a faulty medical device can lead to catastrophic consequences. This is where RPN becomes a game-changer.
- Aerospace: Safety is paramount, and every failure mode is analyzed meticulously to prevent accidents. As aviation expert Todd Curtis notes, “The cost of failure in aerospace is lives—not just dollars.”
- Healthcare: From surgical equipment to diagnostic tools, FMEA helps ensure patient safety. For example, a hospital might use RPN to prioritize risks in sterilization processes to prevent infections.
- Automotive: Companies like Tesla and Toyota rely on FMEA to improve vehicle reliability and avoid costly recalls. A well-known case is Toyota’s 2009 recall, which cost the company billions—an incident FMEA aims to prevent.
In these industries, the consequences of overlooking risks can be severe, making FMEA and RPN indispensable tools for staying ahead of potential failures.
By understanding and implementing the FMEA process and utilizing RPN effectively, organizations can safeguard their operations, protect consumers, and maintain their reputation in an increasingly competitive world.
Breaking Down the RPN Formula
The Risk Priority Number (RPN) is the foundation of Failure Mode and Effects Analysis (FMEA). It acts as a numerical compass, guiding organizations to identify and address risks based on their priority. The formula for calculating RPN is straightforward yet powerful:
RPN = Severity (S) × Occurrence (O) × Detection (D)
Each of these three components—Severity, Occurrence, and Detection—is rated on a predefined scale, and their product provides a quantitative assessment of risk. Let’s break down each element and understand how they work together.
1. Severity (S)
Definition: Severity measures the potential impact of a failure mode on the system, end-user, or process. It reflects the seriousness of the consequences if the failure were to occur.
Scales: Severity is typically rated on a scale of 1 to 10, where:
| Score | Impact Description |
|---|---|
| 1 | Negligible impact; no noticeable effect on system or user. |
| 2–4 | Minor inconvenience or slight performance degradation. |
| 5–7 | Moderate impact; noticeable issues that require action. |
| 8–9 | Severe consequences; major system failure or customer impact. |
| 10 | Catastrophic impact; causes safety risks, injury, or fatality. |
Criteria for Assigning Scores:
- Automotive: In a braking system, a failure that prevents the car from stopping has a severity rating of 10 because it endangers lives. A squeaky brake pad, though inconvenient, might score a 3.
- Healthcare: A failure in a heart monitor to provide accurate readings could result in life-threatening consequences, earning a 9 or 10 severity score.
Examples:
- Use team discussions to agree on the potential consequences of the failure.
- Reference industry-specific standards (e.g., automotive: AIAG-VDA FMEA guidelines).
When rating severity, teams should focus on the worst-case scenario impact to ensure a robust safety net.
2. Occurrence (O)
Definition: Occurrence measures the likelihood of a failure mode happening. It considers historical data, process stability, and environmental factors to estimate the probability of failure.
Scales: Like severity, occurrence is typically rated on a scale of 1 to 10:
| Score | Probability Description | Likelihood |
|---|---|---|
| 1 | Extremely unlikely; less than 1 in a million. | ~0.0001% |
| 2–4 | Low probability; rare failures. | ~1 in 10,000 to 1 in 1,000. |
| 5–7 | Moderate probability; occasional failures. | ~1 in 1,000 to 1 in 100. |
| 8–9 | High probability; frequent failures. | ~1 in 10 to 1 in 2. |
| 10 | Almost certain; failure is inevitable or constant. | Close to 100% |
Criteria for Assigning Scores:
- Historical Data: How often has this failure mode occurred in the past? Use data from similar processes or systems.
- Process Design: Is the process well-controlled? Stable processes are less likely to experience failures.
- External Conditions: Environmental factors, such as extreme temperatures, can increase the likelihood of failures.
Examples:
- In a manufacturing process, a machine that has been well-maintained and calibrated might have an occurrence score of 2, while a machine operating under high stress without regular maintenance might score 8 or higher.
- In software development, a bug in a critical algorithm that frequently recurs during testing could be rated as an 8.
Assigning occurrence scores requires cross-functional expertise to evaluate all influencing factors accurately.
3. Detection (D)
Definition: Detection reflects the ability to identify a failure mode before it affects the end-user or process. A low detection score signifies robust monitoring and controls, while a high score indicates a weak or non-existent detection system.
Scales:
| Score | Detection Capability Description |
|---|---|
| 1 | Failure is almost certain to be detected and corrected. |
| 2–4 | Good detection methods in place; high likelihood of spotting issues. |
| 5–7 | Moderate detection capability; some failures may go unnoticed. |
| 8–9 | Poor detection methods; failure is unlikely to be caught in time. |
| 10 | No detection mechanisms; failure will remain unnoticed. |
Criteria for Assigning Scores:
- Assess current detection systems (e.g., sensors, testing, quality checks).
- Evaluate how well these methods catch issues before they escalate.
Impact on RPN: Detection often receives less attention than severity and occurrence, but it is a critical factor in risk prioritization. If detection mechanisms are weak, even a moderately severe and infrequent failure can have significant consequences.
Examples:
- In healthcare, if a diagnostic tool includes automated alerts for malfunctions, the detection score might be 2. Without such alerts, the score could rise to 8 or more.
- In aerospace, regular inspections using advanced imaging technologies can help detect potential failures early, keeping the detection score low.
Detection ratings encourage teams to invest in improved monitoring, testing, and preventive measures.
Comparison of Scoring Systems: 1–10 vs. 1–5
The scales used for Severity, Occurrence, and Detection can vary based on industry preferences. Let’s compare the two common systems:
1–10 Scale:
- Widely adopted across industries, particularly in manufacturing and automotive.
- Provides greater granularity, enabling nuanced risk assessments.
- Example: A failure mode scoring (S=7, O=8, D=5) produces an RPN of 280.
1–5 Scale:
- Simpler and faster to use, often preferred for smaller teams or less complex processes.
- May lack precision in distinguishing between closely ranked risks.
- Example: The same failure mode rated (S=4, O=4, D=3) yields an RPN of 48.
Industry-Specific Applications:
- Automotive and Aerospace: The 1–10 scale is standard, aligning with rigorous standards like AIAG-VDA and SAE guidelines.
- Small Enterprises: Often favor the 1–5 scale for its simplicity and ease of implementation.
Understanding the RPN formula and its components is the first step toward effective risk prioritization. By carefully assigning scores for Severity, Occurrence, and Detection, organizations can ensure that their resources are directed where they matter most—minimizing risks and maximizing safety, reliability, and quality.
Step-by-Step RPN Calculation
Understanding how to calculate the Risk Priority Number (RPN) is crucial for organizations aiming to prioritize risks and implement effective corrective actions. In this section, we’ll walk through a practical example, provide a real-world case study, and highlight tools and visual aids that simplify the process.
Practical Example: Calculating RPN for a Car Part
Let’s consider a manufacturing scenario where a company is producing brake pads for cars. The goal is to assess potential failure modes and calculate their RPN values to identify which risks require immediate attention.
Steps in the Process:
- Identify Potential Failure Modes:
- Failure Mode 1: Brake pad wear beyond acceptable limits.
- Failure Mode 2: Improper adhesion of the friction material.
- Failure Mode 3: Cracks forming on the brake pad.
- Assign Ratings for Severity (S), Occurrence (O), and Detection (D) based on team discussions:
- Severity: Impact of the failure on safety and function.
- Occurrence: Likelihood of the failure occurring.
- Detection: Likelihood of detecting the failure before it causes harm.
- Calculate RPN using the formula:RPN=S×O×D\text{RPN} = S \times O \times DRPN=S×O×D
Example Data:
| Failure Mode | Severity (S) | Occurrence (O) | Detection (D) | RPN (S × O × D) |
|---|---|---|---|---|
| Brake pad wear beyond limits | 9 | 6 | 5 | 270 |
| Improper adhesion of material | 7 | 5 | 8 | 280 |
| Cracks forming on the brake pad | 8 | 4 | 3 | 96 |
Analysis:
- Improper adhesion has the highest RPN (280), indicating it is the most critical risk and requires immediate corrective action.
- Brake pad wear has a high RPN (270), suggesting it also needs attention, but it’s slightly less critical than the first issue.
- Cracks forming has a lower RPN (96), indicating it is a less urgent issue.
Case Study: Real-World Scenario
Scenario: Risk Assessment in a Healthcare Device Manufacturing Process
A company producing portable insulin pumps conducted an FMEA to identify potential risks in their manufacturing process. Below is the summary of their findings:
| Failure Mode | Severity (S) | Occurrence (O) | Detection (D) | RPN (S × O × D) |
|---|---|---|---|---|
| Device battery failure | 10 | 5 | 6 | 300 |
| Leakage in insulin delivery mechanism | 9 | 7 | 4 | 252 |
| LCD screen malfunction | 5 | 4 | 8 | 160 |
Insights:
- Battery failure was identified as the top priority with an RPN of 300 due to its severe impact on patient safety and moderate detectability.
- The team decided to redesign the battery compartment and add redundant monitoring systems to mitigate the risk.
- For leakage, the company implemented stricter quality control processes during assembly.
- LCD malfunctions were deprioritized due to lower severity and occurrence rates.
Visualization: Charts and Graphs
To make the RPN calculation and prioritization process clearer, visual tools can be highly effective. Below are some suggested visualizations:
1. Bar Chart: RPN Rankings
A bar chart can illustrate the RPN values for different failure modes, making it easy to identify the highest-priority risks.
Example: A bar chart where the Y-axis represents RPN values, and the X-axis lists the failure modes.
2. Risk Matrix
A 2D risk matrix plots Severity (Y-axis) against Occurrence (X-axis). Each point represents a failure mode, with the color coding indicating RPN levels (e.g., red for high risk, yellow for medium, green for low).
3. Pareto Chart
A Pareto chart ranks failure modes by RPN in descending order and adds a cumulative percentage line. This follows the 80/20 rule, emphasizing that 80% of the risk is often caused by 20% of the failure modes.
Click to Download Pareto Chart
4. Heatmap
A heatmap visually represents the RPN values across multiple failure modes, with darker colors indicating higher risks. This provides an at-a-glance view of critical issues.
Tools for Automating RPN Calculations
Manually calculating RPN values can be tedious, especially for large-scale FMEA projects. Thankfully, a variety of tools and software solutions are available to streamline the process:
1. Microsoft Excel
- Excel is a versatile tool for performing RPN calculations using formulas and conditional formatting.
- You can use built-in features like pivot tables and charts to visualize data.
2. XFMEA by ReliaSoft
- This specialized software automates FMEA processes, including RPN calculations.
- It offers advanced features like risk matrices, report generation, and real-time updates for collaborative teams.
3. FMEA Studio
- An Excel-based plugin designed for conducting FMEA analysis.
- It simplifies RPN calculations and visualizations with pre-configured templates.
4. Other Tools
- RiskWatch: Integrates FMEA with broader risk management frameworks.
- iGrafx: Provides comprehensive tools for process mapping and FMEA.
- OpenFMEA: A free, open-source tool for smaller teams or academic use.
Key Takeaways
- Calculating RPN involves assigning appropriate scores for Severity, Occurrence, and Detection and using their product to rank risks.
- Visual tools like bar charts, risk matrices, and Pareto charts make it easier to interpret and prioritize risks.
- Automating RPN calculations using Excel or specialized software reduces errors and saves time, allowing teams to focus on implementing corrective actions.
- Whether you're manufacturing car parts, medical devices, or software, understanding RPN values ensures you prioritize resources on what matters most—preventing failures and safeguarding quality.
Using RPN for Risk Prioritization
The Risk Priority Number (RPN) is not just a calculation—it’s a strategic tool that helps teams focus on addressing the most critical risks first. However, effectively prioritizing risks using RPN requires structured methods, clear strategies, and an understanding of its limitations. Let’s explore how RPN can be used for risk prioritization and what considerations need to be made beyond the numbers.
Methods to Rank Risks
1. Threshold-Based Prioritization
This method involves setting a specific RPN threshold above which risks are considered unacceptable and require immediate corrective action. For instance:
- RPN ≥ 150: High-priority risks requiring urgent mitigation.
- RPN between 50 and 149: Medium-priority risks to be addressed after high-priority issues.
- RPN < 50: Low-priority risks that can be monitored or accepted.
Advantages:
- Simple to implement and communicate across teams.
- Establishes clear action criteria, ensuring that resources are focused on the most severe risks.
Example: In a pharmaceutical manufacturing process, any failure mode with an RPN of 150 or higher might trigger an immediate review of quality controls, whereas risks with lower RPNs are scheduled for periodic monitoring.
2. Top-Risk Focus Strategy
Instead of relying on a fixed threshold, this strategy focuses on tackling the top-ranked risks first, regardless of their RPN values. Teams can:
- Identify the top 10% or 20% of failure modes with the highest RPNs.
- Address these high-priority risks systematically before moving on to lower-ranked ones.
Advantages:
- Ensures that the most critical risks are always addressed first.
- Accounts for scenarios where thresholds may not be appropriate for every situation.
Example: In an automotive assembly line, if the top three failure modes account for 80% of potential risks (following the Pareto principle), the team will address these first to maximize impact.
RPN Matrix Visualization
Visualizing RPN values can significantly enhance risk prioritization by providing a clear, graphical representation of risk levels. The most common methods include:
1. 2D Risk Matrix: Severity vs. Occurrence
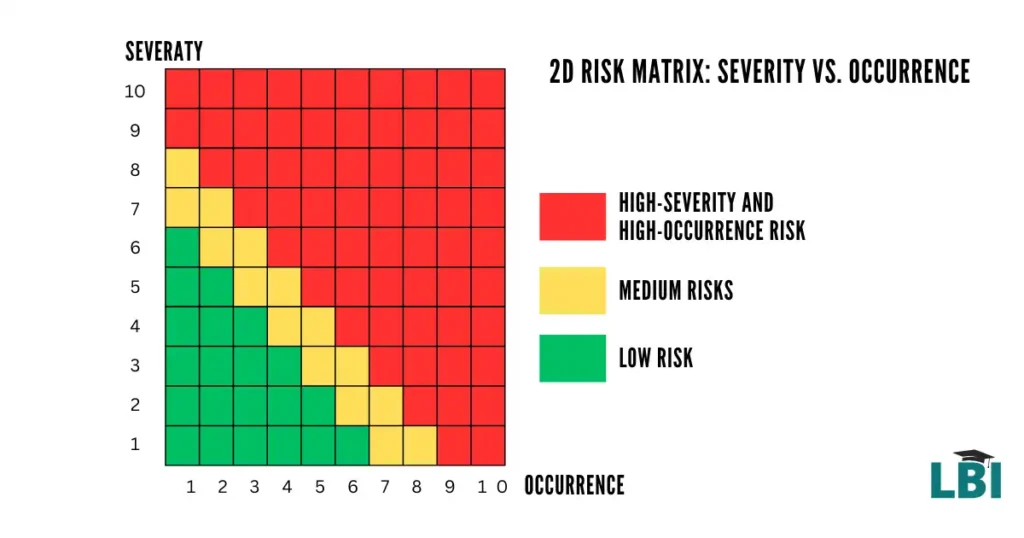
This matrix plots Severity on the Y-axis and Occurrence on the X-axis, with each failure mode represented as a point. The matrix is divided into color-coded zones:
- Red Zone: High-severity and high-occurrence risks that require immediate action.
- Yellow Zone: Medium risks that need monitoring or action over time.
- Green Zone: Low risks that can be accepted or deprioritized.
Example: A failure mode with Severity = 9 and Occurrence = 8 would fall in the red zone, demanding urgent mitigation.
2. 3D Risk Matrix: Adding Detection
Adding Detection as a third axis creates a 3D risk matrix, offering a more comprehensive view of failure modes. While this visualization is more complex, it provides deeper insights into risks that may have similar RPN values but differ in detection capabilities.
Example: Two failure modes may have an RPN of 120, but if one has a Detection score of 9 (indicating poor detectability) and the other has a Detection score of 3, the former would take priority due to its higher risk of going unnoticed.
3. Heatmaps
Heatmaps color-code RPN values, making it easy to identify high-risk areas. For example:
- Dark red: RPN > 250
- Orange: RPN between 150 and 249
- Yellow: RPN between 50 and 149
- Green: RPN < 50
These visualizations ensure quick and intuitive understanding, especially in collaborative discussions.
Considerations Beyond RPN
While RPN is a valuable tool for risk prioritization, relying solely on its numerical value can be misleading. Here are some key considerations:
1. Identical RPN Values
Two failure modes can have the same RPN but vastly different risk profiles. For example:
- Failure Mode A: Severity = 9, Occurrence = 2, Detection = 5 (RPN = 90)
- Failure Mode B: Severity = 3, Occurrence = 6, Detection = 5 (RPN = 90)
While the RPN is identical, Failure Mode A poses a greater safety risk due to its high severity and should be prioritized.
Solution:
- Consider the individual factors (Severity, Occurrence, Detection) alongside the RPN.
- Focus on high-severity risks, even if their RPN is not the highest.
2. Unequal Weighting of Factors
The RPN formula assumes that Severity, Occurrence, and Detection are equally important, which may not always be true. For example, in life-critical systems (e.g., medical devices or aviation), Severity often outweighs the other factors.
Solution:
- Use alternative models, such as Criticality Analysis (Severity × Occurrence) or Weighted RPN (assigning different weights to the factors based on their importance).
3. Context-Specific Risks
Some risks may have a low RPN but still require immediate attention due to regulatory, reputational, or customer-driven factors. For example:
- A defect with a low severity but high customer visibility might demand quick resolution to avoid brand damage.
Solution:
- Supplement RPN analysis with qualitative assessments and expert judgment.
- Consider external factors like regulatory compliance, industry standards, and stakeholder expectations.
Bringing it All Together
Using RPN for risk prioritization involves more than just crunching numbers—it’s about interpreting those numbers in the context of real-world scenarios. By combining threshold-based methods, top-risk strategies, and visual tools like risk matrices, organizations can make data-driven decisions that align with their goals and constraints.
However, it’s equally important to recognize RPN’s limitations and go beyond the numbers when necessary. By considering individual risk factors, unequal weighting, and context-specific nuances, teams can develop a more holistic approach to risk prioritization, ensuring safety, reliability, and customer satisfaction.
Limitations of RPN and Advanced Alternatives
The Risk Priority Number (RPN) has become a staple in Failure Mode and Effects Analysis (FMEA), but it is not without its shortcomings. While the formula provides a quick and structured way to prioritize risks, it sometimes oversimplifies the complex realities of risk management. This section delves into the limitations of RPN, why identical RPN values may not represent identical risks, and introduces advanced alternatives that address its shortcomings.
1. Identical RPN Values: Why They Can Be Misleading
One of the most significant limitations of RPN is its inability to differentiate between failure modes with the same numerical value but vastly different risk profiles. For example:
| Failure Mode | Severity (S) | Occurrence (O) | Detection (D) | RPN (S × O × D) |
|---|---|---|---|---|
| Mode A: Critical Safety Issue | 9 | 2 | 5 | 90 |
| Mode B: Minor Cosmetic Defect | 3 | 6 | 5 | 90 |
Both failure modes result in an RPN of 90, but Mode A poses a much greater threat due to its high severity score, especially in contexts where safety is paramount. Treating these risks as equally critical could lead to inefficient allocation of resources.
Solution:
- When RPN values are identical, consider the Severity rating as the decisive factor, particularly in safety-critical industries.
- Use visualization tools like risk matrices to compare Severity, Occurrence, and Detection values more holistically.
2. Balancing High-Severity Risks with Lower Detection/Occurrence Scores
Another challenge with RPN is its multiplicative nature, which can disproportionately lower the priority of high-severity risks if the Occurrence or Detection scores are low. For example:
| Failure Mode | Severity (S) | Occurrence (O) | Detection (D) | RPN (S × O × D) |
|---|---|---|---|---|
| Mode C: High-Severity Failure | 10 | 2 | 2 | 40 |
| Mode D: Moderate Risk | 5 | 4 | 3 | 60 |
In this scenario, Mode C has a lower RPN than Mode D, but its high severity demands immediate attention. By focusing purely on RPN, organizations risk under-prioritizing serious issues.
Solution:
- Introduce a weighted system or supplementary metrics that give greater importance to Severity.
- Use advanced methods like the Criticality Analysis or SOD Model (explained below).
3. Introducing Advanced Alternatives
To overcome the limitations of RPN, several alternative approaches have been developed. These alternatives either modify the RPN calculation or provide entirely new frameworks for risk prioritization.
a) Criticality Analysis (Severity × Occurrence)
The Criticality Analysis method simplifies the prioritization process by focusing only on Severity and Occurrence. Detection is excluded because it can sometimes mask critical risks, as shown in the examples above.
Criticality=Severity (S)×Occurrence (O)
Advantages:
- Emphasizes the likelihood and impact of a failure, ensuring high-severity risks are not overlooked.
- Easier to calculate and interpret, especially in safety-focused industries.
Example: Using Criticality, the High-Severity Failure (Mode C in the earlier example) scores:
Criticality=10×2=20
This score highlights its priority over lower-severity risks.
b) SOD Model (Weighted RPN)
The SOD Model introduces weighting factors to Severity, Occurrence, and Detection, reflecting their relative importance in specific industries or processes. For example:
[math]\text{Weighted RPN} = (w_s \times S) \times (w_o \times O) \times (w_d \times D)[/math]
Where [math]w_s, \ w_o, \ \text{and} \ w_d[/math] are the weights assigned to Severity, Occurrence, and Detection, respectively.
Advantages:
- Provides flexibility to emphasize the most critical factors.
- Customizable for industry-specific applications (e.g., prioritizing Severity in healthcare, or Detection in manufacturing).
Example: In a medical device manufacturing process:
- [math]w_s = 2, \quad w_o = 1, \quad w_d = 0.5[/math]
For a failure mode with s = 8, o = 5, and d = 6:
Weighted RPN = (2×8)×(1×5)×(0.5×6)=240
This approach prioritizes risks with high Severity.
c) Advanced Tools: AI-Based Risk Assessment and Predictive Analytics
Artificial Intelligence (AI) and predictive analytics are revolutionizing how organizations approach risk management. By analyzing historical data, AI tools can predict failure modes and assign dynamic risk scores based on real-time insights.
Examples of AI Applications:
- Predictive Risk Models: Machine learning algorithms analyze trends to identify high-risk areas even before failure modes occur.
- Dynamic Risk Scoring: AI adjusts Severity, Occurrence, and Detection ratings dynamically as new data becomes available.
- Anomaly Detection: Advanced monitoring systems use AI to detect deviations in processes, reducing the reliance on manual Detection ratings.
Tools:
- XFMEA by ReliaSoft: Integrates predictive models and visualizations for advanced risk analysis.
- RiskWatch: Uses AI to predict and prioritize risks in real-time.
- Pyramid Analytics: Combines statistical methods and machine learning for holistic risk assessment.
4. Comparing RPN and Advanced Alternatives
| Metric | Pros | Cons | Best Use Cases |
|---|---|---|---|
| Traditional RPN | Simple to calculate; widely used; easy to communicate. | Ignores identical RPN pitfalls; equally weights Severity, Occurrence, and Detection. | General manufacturing, small-scale projects. |
| Criticality Analysis | Emphasizes Severity and Occurrence; avoids masking by Detection scores. | Detection capability is not considered. | Safety-critical industries (e.g., healthcare, aerospace). |
| SOD Model | Flexible; customizable weighting for industry-specific needs. | Slightly more complex; requires subjective weight assignment. | Industries with varied risk factors (e.g., automotive, electronics). |
| AI-Based Tools | Real-time, predictive, and dynamic; integrates historical data and machine learning. | High initial cost; requires technical expertise and reliable data. | Complex systems, large-scale manufacturing, data-driven decision-making. |
5. Key Takeaways
While RPN is a useful tool, its limitations make it essential to supplement or replace it with more advanced alternatives in certain scenarios. Identical RPN values and the equal weighting of risk factors can lead to suboptimal prioritization, particularly in high-stakes industries.
By incorporating methods like Criticality Analysis, the SOD Model, and AI-based tools, organizations can gain deeper insights, prioritize risks more effectively, and ensure resources are directed to where they matter most. As technology continues to evolve, combining traditional approaches with modern analytics can empower organizations to stay ahead of potential failures, safeguard operations, and deliver superior outcomes.
FMEA: Failure, Modes, Effects, Analysis | Certification Course
Buy Now for $13.99
Udemy prices may vary depending on applied coupons and promotional events.
- 🧑🏫 29 lectures
- ⌚ 2h 3m total length
- 🗃️ 6 downloadable resources
- 📜 Certificate of completion
- 👩🎓 12,634 students
- ⭐ 4.7 rating by 482 students
We offer a detailed breakdown of RPN in our highest-rated Failure Modes and Effects Analysis (FMEA) course on Udemy. If you're interested in exploring other tools within the FMEA methodology, consider enrolling in our course.
Applications of RPN in Various Industries
The Risk Priority Number (RPN) is a versatile tool that has found applications across diverse industries. Its ability to prioritize risks makes it indispensable in sectors where safety, reliability, and quality are paramount. Let’s explore how RPN is used in specific industries such as automotive, healthcare, and aerospace, along with real-world case studies showcasing its successful implementation.
1. Automotive Industry: Ensuring Reliability and Safety
The automotive industry has been one of the earliest adopters of Failure Mode and Effects Analysis (FMEA) and RPN. Here, RPN is integral to Design FMEA (DFMEA) and Process FMEA (PFMEA), ensuring the reliability and safety of vehicles.
Key Applications:
- Parts Failure Analysis: Automotive manufacturers use DFMEA to analyze potential failure modes in critical components like brakes, engines, and airbags. RPN helps prioritize which issues to address first based on their impact on safety and vehicle performance.
- Process Optimization: PFMEA is used to identify risks in production processes. For instance, risks in welding or assembly operations are ranked using RPN, ensuring that defects are detected and mitigated early.
Case Study:
Company: Toyota
Scenario: During the production of a new braking system, Toyota conducted an FMEA to identify potential failure modes. One failure mode, “brake pedal stiffness,” had an RPN of 360 (Severity: 9, Occurrence: 8, Detection: 5). This was flagged as a top priority. The team implemented enhanced testing protocols and modified the material composition to reduce stiffness, lowering the RPN to 90.
Outcome: This proactive risk management prevented costly recalls and ensured customer safety.
2. Healthcare Industry: Reducing Errors in Medical Devices
In healthcare, the stakes are incredibly high—errors in medical devices or processes can result in life-threatening consequences. RPN is widely used to mitigate risks in medical device manufacturing, hospital operations, and pharmaceutical processes.
Key Applications:
- Medical Device Design: Manufacturers use RPN to identify risks in devices like insulin pumps, pacemakers, and diagnostic tools. Failure modes such as battery failure or inaccurate readings are analyzed to ensure patient safety.
- Hospital Operations: FMEA and RPN are applied to critical hospital processes like sterilization, medication delivery, and patient monitoring. Risks are assessed to prevent errors and ensure compliance with regulatory standards.
Case Study:
Organization: A leading medical device manufacturer
Scenario: The company was designing a portable insulin pump. One failure mode, “inconsistent insulin delivery,” was assigned an RPN of 400 (Severity: 10, Occurrence: 5, Detection: 8). The high RPN prompted the team to redesign the delivery mechanism and enhance detection systems with real-time alerts.
Outcome: Post-implementation, the RPN was reduced to 120. The device achieved regulatory approval and gained trust from healthcare providers and patients.
3. Aerospace Industry: Addressing Safety-Critical Risks
The aerospace industry operates under strict safety standards, where even minor failures can lead to catastrophic consequences. RPN is an essential tool in identifying and mitigating risks in aircraft systems, engine components, and space exploration equipment.
Key Applications:
- System Reliability: Aerospace engineers use RPN to evaluate risks in critical systems like flight controls, landing gear, and navigation. For example, a failure in hydraulic systems is analyzed to prevent mid-flight incidents.
- Compliance with Standards: Regulatory requirements such as those from the Federal Aviation Administration (FAA) and European Union Aviation Safety Agency (EASA) mandate rigorous risk assessments using FMEA and RPN.
Case Study:
Organization: Airbus
Scenario: During the development of an advanced avionics system, Airbus identified a failure mode: “data loss during flight.” The initial RPN was 320 (Severity: 10, Occurrence: 4, Detection: 8). Engineers implemented redundant data storage and improved system monitoring, reducing the RPN to 80.
Outcome: The updated system passed safety certifications and enhanced the reliability of Airbus’s aircraft.
4. Cross-Industry Applications: Shared Lessons
Beyond these industries, RPN has found applications in other domains, including energy, consumer electronics, and logistics. For instance:
- Renewable Energy: In solar panel manufacturing, FMEA and RPN are used to address risks like module degradation and electrical failures.
- Consumer Electronics: Smartphone manufacturers use RPN to minimize risks such as battery overheating or screen malfunctions.
- Supply Chain Management: RPN helps logistics companies assess risks like delayed shipments or inventory shortages.
Key Takeaways from Successful Implementation
- Proactive Risk Management: Industries leveraging RPN ensure that risks are addressed before they escalate into failures. For example, automotive manufacturers use it to prevent safety-critical defects, avoiding recalls and liability issues.
- Regulatory Compliance: RPN-driven FMEA is often a requirement for compliance with standards such as ISO 13485 (medical devices), ISO/TS 16949 (automotive), and AS9100 (aerospace). Organizations that prioritize high-RPN risks are better equipped to meet these standards.
- Enhanced Product Quality: By addressing high-RPN risks, companies improve product reliability and customer satisfaction. This is particularly important in industries like healthcare and aerospace, where quality is non-negotiable.
- Cost Savings: Early detection and mitigation of high-risk failure modes significantly reduce costs associated with recalls, rework, and warranty claims.
From ensuring the safety of vehicles to saving lives through reliable medical devices and aerospace systems, RPN plays a vital role in risk management across industries. By prioritizing high-risk failure modes, organizations can proactively address potential issues, meet regulatory requirements, and deliver high-quality, reliable products. With real-world case studies as proof, it’s clear that the effective use of RPN is not just a best practice—it’s a necessity.
Improving RPN with Modern Technologies
In today’s fast-paced industries, the traditional calculation and use of the Risk Priority Number (RPN) is being revolutionized by modern technologies. Tools like Artificial Intelligence (AI), machine learning, and advanced analytics are enhancing the effectiveness of Failure Mode and Effects Analysis (FMEA) by making risk management more proactive, precise, and dynamic. Let’s explore how these technologies are transforming RPN calculations and usage.
1. The Role of AI in Enhancing FMEA and RPN Calculations
a) Machine Learning for Predictive Risk Assessment
Machine learning algorithms are game-changers in risk assessment. Unlike traditional FMEA, which relies on historical data and team consensus, machine learning can analyze massive datasets to predict failure modes, detect patterns, and provide dynamic risk scores.
How It Works:
- Data Input: Algorithms analyze historical failure data, process conditions, and external factors (e.g., temperature, vibration, humidity).
- Predictive Models: Based on these inputs, machine learning models identify potential failure modes and assign probabilities for occurrence, severity, and detection.
- Dynamic Adjustments: As more data is collected, the model evolves, offering increasingly accurate predictions.
Example: In manufacturing, AI systems can predict when a machine is likely to fail based on vibration patterns. The system assigns a high occurrence score to this failure mode, updating the RPN dynamically.
b) Community Insights for Refining Detection Capabilities
One of the challenges of traditional FMEA is accurately rating Detection (D), which often depends on subjective team assessments. Modern tools are leveraging community insights and collaborative platforms to refine these scores.
How It Works:
- Crowdsourced Data: Platforms aggregate data from multiple organizations, industries, and use cases to establish benchmarks for detection scores.
- Expert Contributions: Communities of engineers and quality managers share best practices and lessons learned, creating a shared knowledge base.
Example: A medical device manufacturer could compare its detection methods for identifying leaks in insulin pumps to industry benchmarks, ensuring that its Detection (D) scores are realistic and aligned with global best practices.
2. Integrating RPN with CAPA (Corrective and Preventive Actions)
Corrective and Preventive Actions (CAPA) are essential processes for addressing risks and ensuring continuous improvement. Modern technologies are enabling tighter integration between RPN and CAPA workflows, creating a seamless loop from risk identification to resolution.
How Integration Works:
- Automated CAPA Triggering: High RPN values automatically generate CAPA tasks, ensuring immediate action.
- Prioritization: CAPA systems prioritize tasks based on RPN, directing resources to the most critical issues.
- Tracking and Feedback: Advanced tools monitor the implementation of corrective actions and track their impact on reducing RPN scores.
Example: In aerospace, a high RPN for a potential hydraulic system failure might trigger a CAPA workflow. The system assigns tasks to engineers, tracks progress, and recalculates RPN values after the corrective action is implemented.
Benefits:
- Reduces manual effort in linking FMEA with CAPA systems.
- Ensures that risk mitigation efforts are aligned with organizational priorities.
- Provides real-time feedback on the effectiveness of corrective actions.
3. Real-Time Monitoring of Risk Metrics in Complex Systems
In industries like healthcare, aerospace, and manufacturing, real-time monitoring is critical to staying ahead of risks. IoT (Internet of Things) devices, sensors, and advanced analytics platforms now allow organizations to monitor risk metrics continuously and adjust RPN values in real time.
How Real-Time Monitoring Enhances RPN:
- Sensor Data Integration: Sensors embedded in equipment provide real-time data on conditions like temperature, pressure, or vibrations.
- Dynamic Updates: RPN values are recalculated automatically as new data comes in, allowing for immediate adjustments to risk prioritization.
- Alerts and Dashboards: AI-driven dashboards alert teams to risks that exceed predefined thresholds, ensuring swift action.
Example: In a smart factory, IoT sensors detect abnormal vibrations in a robotic arm. The system recalculates the RPN for a potential joint failure and alerts the maintenance team, preventing costly downtime.
Case in Point: Healthcare
Hospitals increasingly use real-time monitoring for patient safety. For example:
- Sensors on infusion pumps track flow rates and detect anomalies in real time.
- If a potential failure mode (e.g., inconsistent flow) is detected, the RPN is updated, and staff are alerted to intervene immediately.
4. Advanced Analytics for Visualization and Reporting
Modern technologies also enhance how organizations visualize and communicate RPN-related insights. Tools like heatmaps, predictive dashboards, and drill-down analytics provide actionable intelligence at a glance.
Visualization Enhancements:
- Heatmaps: Color-coded visualizations of RPN values across processes or systems, highlighting critical risks.
- Predictive Dashboards: Real-time updates and trend analyses showing how RPN values evolve over time.
- Root Cause Analysis Integration: Tools that link RPN values to underlying causes, helping teams identify and address the root of the problem.
Example: An aerospace company uses a dashboard to monitor RPN trends across its fleet maintenance operations. A heatmap highlights that hydraulic system risks are rising, prompting immediate investigation.
5. Key Benefits of Modern Technologies in RPN Management
- Proactive Risk Management: By predicting failure modes before they occur, organizations can shift from reactive to proactive risk management.
- Enhanced Accuracy: AI and community insights eliminate much of the subjectivity inherent in traditional RPN calculations.
- Efficiency: Automated workflows and real-time updates save time and ensure resources are directed where they are needed most.
- Scalability: Advanced tools can handle the complexity of large-scale systems, making RPN practical for global operations.
Modern technologies are transforming how organizations approach RPN and risk management. AI-driven predictive models, real-time monitoring, and CAPA integration ensure that risks are identified, prioritized, and addressed more efficiently than ever before. By leveraging these advancements, industries can move beyond static RPN calculations to dynamic, data-driven risk management strategies. This not only improves safety and quality but also positions organizations to thrive in an increasingly complex and competitive world.
Practical Best Practices for RPN Implementation
The effective use of the Risk Priority Number (RPN) requires more than just calculations; it demands structured implementation strategies that align with organizational goals. Properly leveraging RPN involves assembling the right team, ensuring accurate assessments, keeping the process dynamic, and using the insights to drive improvements. Below are the best practices for implementing RPN in a way that maximizes its value.
Building a Robust FMEA Team: Involving Cross-Functional Experts
A strong FMEA process starts with the right team. To capture a comprehensive view of risks, it’s crucial to involve cross-functional experts who bring diverse perspectives and expertise.
- Who to Include:
- Engineers: Provide technical insights into potential failure modes.
- Quality Assurance Professionals: Evaluate detection capabilities and ensure compliance.
- Operators: Share hands-on experience of processes and common challenges.
- Product Managers: Align risk management with customer needs and business goals.
- Suppliers: Highlight potential risks in upstream materials or components.
- Benefits:
- Prevents blind spots in risk identification.
- Facilitates more accurate and informed ratings.
- Enhances buy-in across departments, ensuring smoother implementation of corrective actions.
For example, in an automotive manufacturing plant, involving operators in FMEA discussions often reveals real-world issues, such as equipment wear patterns, that engineers might overlook.
Assigning Accurate Ratings Through Consensus and Calibration
Accurate RPN values depend on assigning appropriate ratings for Severity, Occurrence, and Detection. Subjectivity can skew these ratings, so achieving consensus and calibration within the team is essential.
- Best Practices for Assigning Ratings:
- Use Standardized Scales: Define clear criteria for each score (e.g., a Severity rating of 9 should always represent a life-threatening issue).
- Facilitate Team Discussions: Encourage debates and explanations for each score to avoid individual bias.
- Leverage Historical Data: Use past failure records and metrics to inform Occurrence and Detection ratings.
- Calibrate Regularly:
- Periodically conduct calibration exercises where the team rates hypothetical scenarios and compares their results.
- Use benchmarking data from industry standards (e.g., AIAG-VDA FMEA guidelines) to align ratings with best practices.
For instance, in healthcare device manufacturing, calibration sessions help ensure that a team consistently assigns high Severity scores to risks involving patient safety, even if those risks occur infrequently.
Regularly Reviewing and Updating RPN Values
Static RPN values quickly become irrelevant in dynamic industries where processes, technologies, and risks evolve. Regular reviews are essential to maintain an up-to-date risk assessment.
- When to Update RPN Values:
- After implementing corrective or preventive actions.
- Following significant process or design changes.
- When new failure modes are identified during audits, inspections, or customer feedback.
- Review Frequency:
- For high-risk industries like aerospace or healthcare, review RPN values quarterly or as part of routine quality assurance checks.
- For less critical industries, semi-annual or annual reviews may suffice.
- Tools for Tracking Changes:
- Use software solutions like XFMEA or FMEA Studio to automate updates and maintain historical records.
- Create visual dashboards to monitor trends in RPN values over time, helping teams identify recurring issues or improvements.
A case study from the aerospace industry demonstrates the value of periodic reviews. An avionics manufacturer reduced recurring issues in hydraulic systems by revisiting and recalibrating RPN values after process improvements, leading to a 30% reduction in critical failures.
Using Data from RPN for Continuous Improvement and Stakeholder Communication
RPN isn’t just a tool for identifying risks—it’s also a powerful source of data that can drive continuous improvement and foster transparency with stakeholders.
- Driving Continuous Improvement:
- Analyze historical RPN trends to identify systemic issues, such as frequent failures in specific equipment or processes.
- Use Pareto charts to pinpoint the top failure modes contributing to the majority of risks.
- Set measurable goals for reducing high-RPN risks, such as lowering average RPN scores by 20% over a year.
- Enhancing Stakeholder Communication:
- Share RPN analyses with internal stakeholders (e.g., management, operators) to build awareness and align priorities.
- Provide external stakeholders, such as regulators or clients, with RPN-based reports demonstrating compliance and proactive risk management efforts.
For example, in pharmaceutical manufacturing, regulatory authorities often expect documentation of how RPN values were used to prioritize corrective actions. Transparent communication of these processes builds trust and ensures smoother audits.
- Visualizing RPN Data:
- Heatmaps can quickly highlight areas of concern, such as failure modes with persistently high RPN values.
- Trend lines showing how RPN scores have decreased over time provide concrete evidence of improvement efforts.
Key Implementation Tips
- Automate Where Possible:
- Use tools like Microsoft Excel plugins, XFMEA, or AI-based platforms to streamline calculations and updates.
- Automating workflows reduces human error and saves time.
- Integrate with Broader Risk Management Frameworks:
- Align RPN with CAPA (Corrective and Preventive Actions), ISO standards, or regulatory requirements to ensure a holistic approach.
- Encourage a Culture of Ownership:
- Foster accountability by assigning clear roles and responsibilities for addressing high-RPN risks.
- Celebrate team successes when RPN reductions result in measurable improvements, such as fewer defects or enhanced safety.
- Balance Quantitative and Qualitative Assessments:
- While RPN provides numerical prioritization, supplement it with qualitative assessments, such as the impact on brand reputation or compliance risks.
By following these best practices, organizations can maximize the value of RPN, ensuring that risk management processes are robust, adaptive, and aligned with both operational and strategic goals.
Visual Enhancements and Tools
Effective visualization can transform raw RPN data into actionable insights. By using infographics, comparison tables, and interactive tools, teams can communicate risks clearly, make data-driven decisions, and streamline their FMEA processes. Here’s how visual enhancements and tools can elevate RPN implementation.
1. Infographics: Simplifying Key Concepts
Infographics are an excellent way to summarize complex information and make it accessible to a wide audience. These visual aids can serve as quick references for teams during FMEA sessions.
Examples:
- "RPN Do’s and Don’ts":
- Do: Focus on high-severity risks, revisit RPN values regularly, use calibrated scoring scales.
- Don’t: Rely solely on RPN without context, ignore identical RPN pitfalls, neglect qualitative factors.
- Step-by-Step RPN Calculation:
- Break down the process into simple visuals showing how to assign Severity, Occurrence, and Detection ratings.
- Risk Matrix Heatmaps:
- Color-coded grids to visually differentiate between low, medium, and high risks.
These infographics can be shared as printable resources or embedded into presentations for stakeholder communication.
2. Comparison Tables: Analyzing FMEA Methods and Tools
Comparison tables help teams evaluate and choose the right FMEA approach or software tools based on their specific needs.
Example Table: Comparing FMEA Tools
| Tool | Features | Best For | Pricing |
|---|---|---|---|
| XFMEA | Automated RPN calculation, visual dashboards, regulatory compliance features. | Large-scale industries with complex processes. | Premium subscription. |
| FMEA Studio | Excel-based plugin, simple to use, customizable templates. | Small to mid-sized teams. | Affordable one-time cost. |
| OpenFMEA | Open-source, free to use, basic functionality. | Academic or small-scale projects. | Free. |
Comparison tables like these guide teams in selecting tools that align with their workflows and budgets.
3. Interactive Tools and Downloadable Templates
Interactive tools and templates streamline RPN calculations and enhance team collaboration during FMEA sessions.
Examples:
- Excel Templates:
- Pre-designed templates with automated RPN formulas and conditional formatting to highlight high-risk failure modes.
- Interactive Dashboards:
- Tools like Tableau or Power BI enable real-time tracking of RPN values and trends across processes.
- Online FMEA Platforms:
- Platforms such as ReliaSoft XFMEA or RiskWatch offer collaborative features for cross-functional teams, with built-in RPN calculators, visualizations, and reporting tools.
Benefits:
- Save time and reduce errors by automating calculations.
- Encourage data-driven decisions with dynamic, visual insights.
- Promote collaboration with shared access to templates and dashboards.
By leveraging visual enhancements and interactive tools, organizations can make their RPN processes more transparent, actionable, and aligned with modern risk management practices. These tools not only aid internal teams but also provide clarity to stakeholders, regulators, and clients.
Conclusion and Key Takeaways
The Risk Priority Number (RPN) is a cornerstone of Failure Mode and Effects Analysis (FMEA), serving as a vital tool for identifying, prioritizing, and mitigating risks across industries. From the automotive sector to healthcare and aerospace, RPN has proven its value in preventing failures, ensuring safety, and maintaining quality. However, as industries evolve and systems grow more complex, so too must the methods we use to manage risks.
Critical Aspects of RPN in Risk Management
- Quantitative Decision-Making: RPN provides a numerical basis for prioritizing risks, ensuring that the most critical issues receive attention first.
- Flexibility Across Industries: Its adaptability makes RPN applicable to diverse fields, from medical device manufacturing to aerospace system reliability.
- Structured Approach: By breaking risks into Severity, Occurrence, and Detection, RPN encourages a methodical and comprehensive assessment of potential failure modes.
Evolving RPN Approaches with Industry Needs
While traditional RPN calculations are effective, their limitations—such as equal weighting of factors and identical RPN pitfalls—highlight the need for innovation. Advanced alternatives like the SOD Model, Criticality Analysis, and AI-driven tools allow organizations to overcome these challenges. These approaches make risk management:
- Proactive: Predicting failure modes before they occur.
- Dynamic: Updating RPN values in real time as processes and conditions change.
- Accurate: Reducing subjectivity in scoring through machine learning and community insights.
Professionals must stay updated on these advancements to ensure their FMEA processes remain relevant, efficient, and aligned with industry standards.
FAQ: Common Questions About RPN
What is the ideal RPN threshold for prioritizing risks?
There’s no universal threshold—it varies by industry and organizational context. For example, a threshold of 150 might be used in manufacturing, while healthcare might set stricter thresholds around 100 due to higher stakes.
How often should RPN values be reviewed?
RPN values should be reviewed:
1. After corrective actions are implemented.
2. Following process or design changes.
3. Periodically, such as quarterly or annually, depending on the criticality of the industry.
What are the biggest limitations of RPN?
Key limitations include:
1. Its inability to differentiate between failure modes with identical RPN values.
2. Equal weighting of Severity, Occurrence, and Detection, which may not reflect real-world priorities.
3. Dependence on subjective scoring.
Can RPN calculations be automated?
Yes. Tools like XFMEA, FMEA Studio, and Excel plugins automate RPN calculations, reducing errors and saving time.
Are there alternatives to RPN?
Yes, alternatives like the SOD Model (weighted scoring), Criticality Analysis (Severity × Occurrence), and AI-driven risk assessment offer improved accuracy and flexibility.
How does AI enhance RPN?
AI improves RPN by:
1. Predicting failure modes using machine learning models.
2. Dynamically adjusting scores based on real-time data.
3. Reducing subjectivity in scoring, especially for Detection ratings.