Table of Contents
Why Fault Tree Analysis Matters in Complex Systems
In the world of complex systems, Fault Tree Analysis (FTA) stands out as an indispensable tool for engineers, designers, and safety experts committed to preventing and solving system failures. With its unique top-down approach, FTA visually breaks down the causes of failures, offering a structured method to identify potential issues before they escalate. This approach is particularly vital in industries such as aerospace, automotive, nuclear, and software, where reliability and safety are paramount. By providing a clear visual representation of potential failure points, FTA enhances risk management and reliability engineering, ensuring that complex systems operate smoothly and safely.
Understanding Fault Tree Analysis – A Historical Overview
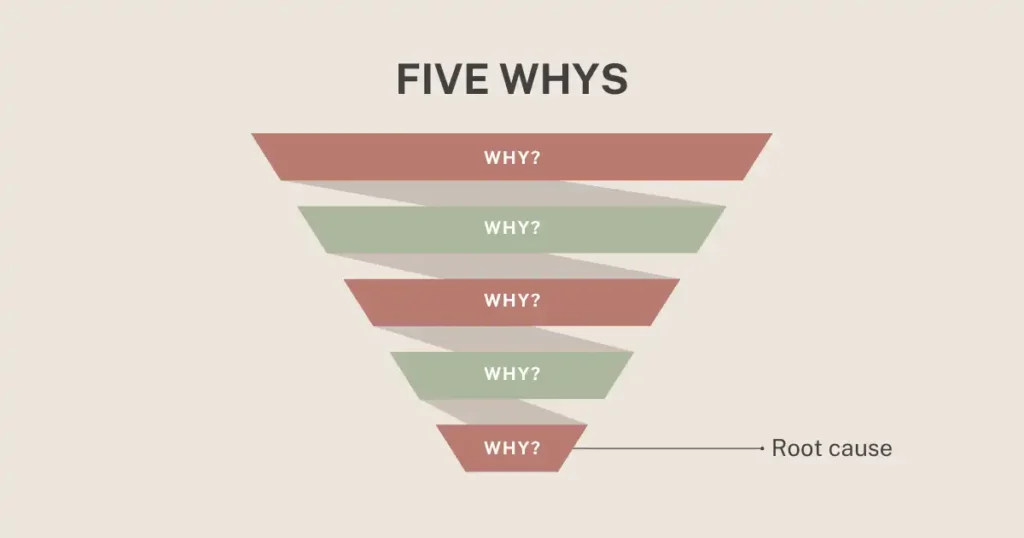
Fault Tree Analysis originated in the 1960s, developed by Bell Laboratories for the U.S. Air Force to assess risks within the Minuteman missile system. This method quickly demonstrated its effectiveness, leading to its adoption across various industries. Notably, companies like Boeing and NASA have integrated FTA into their safety analysis processes, showcasing its enduring relevance. Over time, FTA has evolved and now complements methodologies like Failure Mode and Effects Analysis (FMEA) and Root Cause Analysis (RCA). While FMEA focuses on potential failure modes and their effects, FTA emphasizes understanding the sequence of events leading to a system failure, providing a comprehensive approach to risk management.
How Fault Tree Analysis Works – The Basics
Fault Tree Analysis is a deductive method used to understand failure causes within a system. Here’s how it works:
Defining the Top Event
The process begins by identifying the Top Event, the primary failure under investigation, such as a system breakdown or equipment malfunction.
Identifying Contributing Events
Next, the analysis identifies Contributing Events that could lead to the top event. These are divided into basic events (root causes) and intermediate events (combinations of basic events).
Constructing the Fault Tree
A fault tree is constructed using logic gates (AND, OR, XOR) to visually represent the relationships between events. For example, an OR gate indicates that any input event can cause the output event, while an AND gate requires all input events to occur for the output event.
Performing Quantitative and Qualitative Analysis
The fault tree undergoes both quantitative and qualitative analysis. Quantitative analysis involves calculating the probability of the top event based on the probabilities of basic events. Qualitative analysis identifies minimal cut sets, the smallest combinations of basic events that can lead to the top event, helping prioritize risks.
Example: Electrical Failure in a Manufacturing System
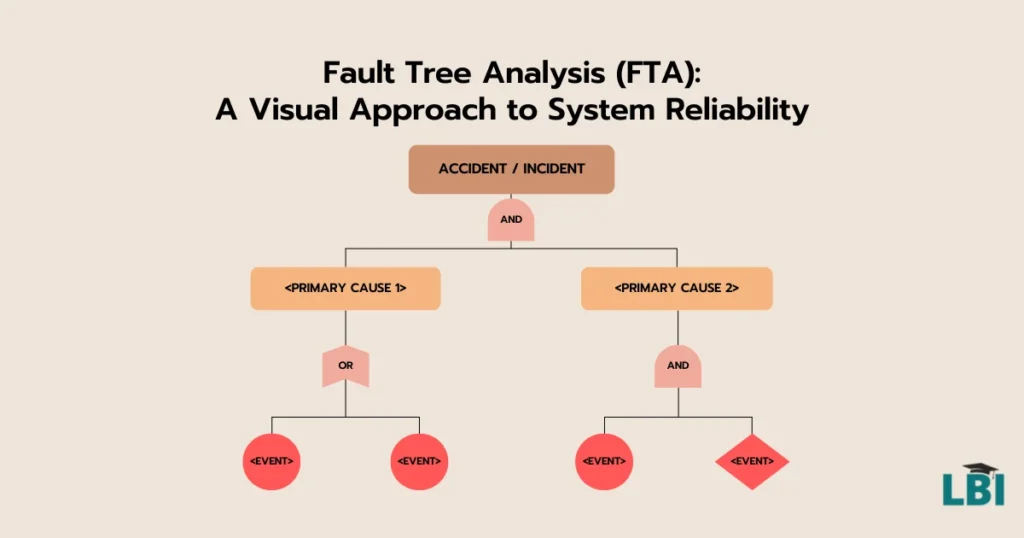
Consider a manufacturing system where the Top Event is a system failure. Basic Events might include a fuse failure and wire shorting. An OR gate links these basic events to the top event, indicating that either event could cause the system to fail. This visual tool helps identify critical areas for intervention.
Fault Tree Syeffectively visualize and analyze the logic behind system failures, making FTA a powerful tool for identifying root causes and implementing preventative measures.
Fault Tree Symbols and Gates – Decoding the Diagram
Fault Tree Analysis (FTA) diagrams use special symbols to show how different problems (events) combine to create bigger issues in a system. These symbols help us figure out what might go wrong, making it easier to prevent big failures. Let’s break down each symbol and gate in a way that’s simple to understand.
Event Symbols – What’s Happening?
Event symbols in FTA represent different types of problems or conditions within a system.
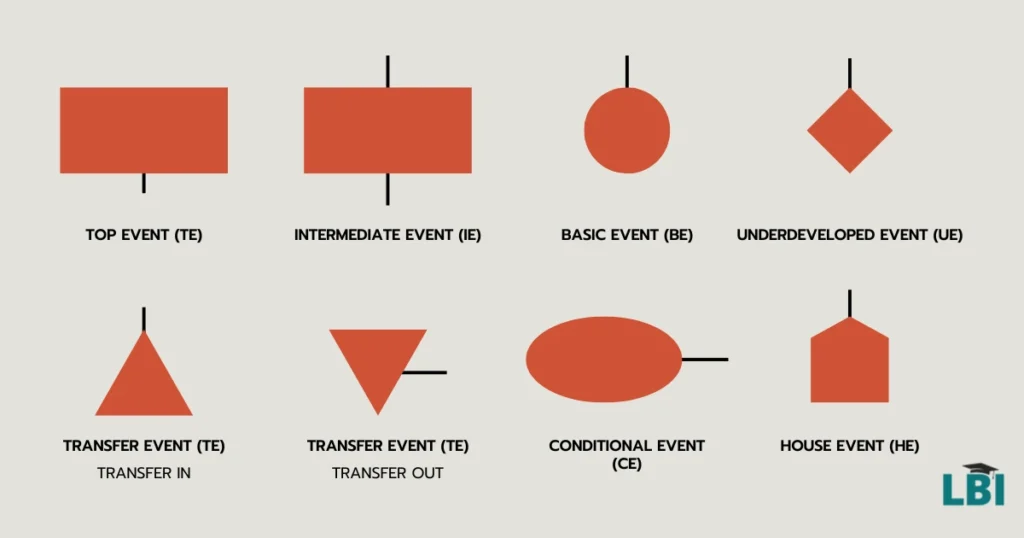
- Top Events:
This is the big problem you’re trying to avoid, like the system shutting down or something important failing. All other events below this lead up to this one. - Basic Events:
These are small problems or failures that don’t need to be broken down further. Think of them as root causes that happen on their own, like a light bulb burning out. - Intermediate Events:
These show what happens when a combination of basic events leads to another issue. For example, if two things break at once, they might cause a bigger problem. - Undeveloped Events:
These are events we don’t have enough information about or that aren’t explored further in the analysis. It’s like knowing something went wrong but not being sure exactly why. - Transfer Events (In and Out):
- In Transfer: This symbol tells us that part of the fault tree is explained somewhere else in the diagram. It’s like a shortcut saying, “Go look over here to find more details.”
- Out Transfer: This points to another part of the diagram and helps keep things tidy. It means the next step is shown somewhere else in the tree.
- Conditional Events:
These events only happen if a certain condition is met. Think of it like a door that only opens if you have the right key. This symbol adds detail to situations where something depends on a specific trigger. - House Events:
These are always true or always false. For example, a safety system that’s always working could be marked as a house event because it never fails. It’s a fixed fact that doesn’t change, simplifying the diagram.
Gate Symbols – How Problems Connect!
Gate symbols show how different problems work together to cause a big issue. They explain how events must combine to create the Top Event (the main problem).
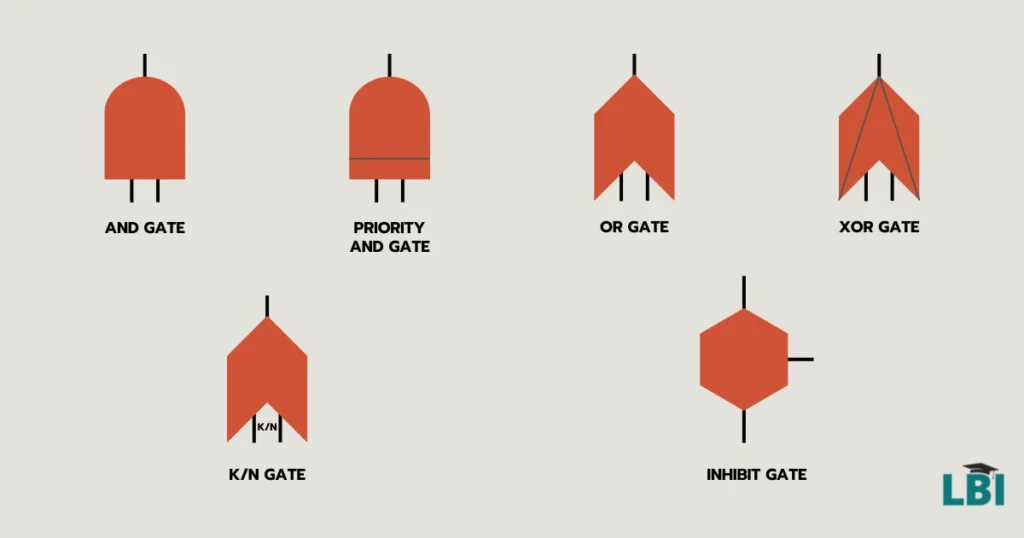
- AND Gate ( ∧ ):
This gate means that all the input events must happen for the big problem to occur. Imagine needing both batteries in a toy to work for it to turn on—if one battery fails, the toy doesn’t work. - OR Gate ( ∨ ):
With this gate, any one of the input events can cause the big problem. It’s like having two ways to open a door—if either one works, the door opens. If one problem happens, the big issue occurs. - XOR Gate (Exclusive OR):
Here, only one event can cause the problem, but not both at the same time. It’s like having two keys to open a door, but only one key can work at a time. If both try, the door won’t open. This gate is used when only one specific failure is allowed to happen. - INHIBIT Gate:
This gate requires both an event and a condition to cause the big problem. It’s like pressing a button, but the button only works if you’re holding a key. The failure only happens if the event occurs and the condition is met. - K/N Gate (Majority Gate):
This gate means that K out of N events must happen for the problem to occur. For example, if you need 2 out of 3 light bulbs to fail for the room to go dark, this gate shows how many events need to go wrong for the big issue to happen. - Priority AND Gate (PAND):
This gate works like the AND gate, but the events must happen in a specific order. It’s like baking a cake—you need to mix the ingredients first, then bake it. If you bake before mixing, the cake won’t turn out right. The order matters here.
Putting It All Together
By understanding these symbols and gates, you can easily follow Fault Tree Analysis diagrams to see how small problems can combine to create bigger issues. Whether it’s understanding when events depend on conditions, or how many problems need to occur before a failure, these symbols make it easier to prevent disasters before they happen.
Fault Tree Analysis is like solving a puzzle: you break down big problems into smaller pieces and see how everything fits together. Once you master these symbols, you’ll be a pro at spotting system failures and figuring out how to stop them!
The Step-by-Step Process of Conducting a Fault Tree Analysis
Conducting a Fault Tree Analysis (FTA) involves a systematic approach to identify and mitigate potential system failures. Here’s a detailed step-by-step guide:
Step 1: Define the Undesired Event
The first step in FTA is to clearly articulate the undesired event—the failure you want to prevent. This top event could be a system breakdown, a safety hazard, or any critical failure that needs to be addressed. For example, in a manufacturing plant, the undesired event might be a complete production halt.
Step 2: Identify Contributing Factors
Next, identify all possible internal and external factors that could contribute to the undesired event. This involves brainstorming sessions and consultations with experts to list out potential failure causes such as component malfunctions, process errors, or environmental impacts. For instance, equipment wear and tear or operator errors might be relevant factors in a manufacturing context.
Step 3: Build the Fault Tree
Using the identified contributing factors, construct the fault tree. Begin by placing the undesired event at the top and progressively break it down into lower-level events using logical gates such as AND, OR, and XOR. These gates help illustrate the relationships between different failure events. An OR gate might be used to indicate that any listed factor could independently cause the top event, while an AND gate suggests that multiple factors must coincide.
Step 4: Gather Failure Data
Collecting accurate failure data is crucial for analysis. Use historical data, industry databases, or expert opinions to estimate the probabilities of different events. This data is foundational for both qualitative and quantitative analysis, offering insights into how likely certain failures are to occur.
Step 5: Analyze the Fault Tree
Conduct a thorough analysis of the fault tree using both qualitative and quantitative methods. The qualitative analysis focuses on identifying minimal cut sets, which are the smallest combinations of basic events that can lead to the top event. Quantitative analysis involves calculating the probabilities of these minimal cut sets to determine the most critical failure modes.
Step 6: Interpret the Results
With the analysis complete, interpret the results by focusing on the most likely failure paths and minimal cut sets. This involves prioritizing risks based on their potential impact and likelihood, enabling targeted interventions to address the most pressing issues.
Step 7: Implement Solutions and Monitor Progress
Finally, develop and implement preventive measures based on the analysis. This may include design modifications, enhanced maintenance protocols, or additional training for personnel. It’s also essential to monitor the effectiveness of these solutions and update the fault tree as needed to reflect any changes in the system or operating environment.
Advantages and Limitations of Fault Tree Analysis
Fault Tree Analysis (FTA) offers several advantages and limitations that users must consider when applying this method in real-world scenarios.
Advantages
- Visual Representation: FTA provides a clear and visual depiction of system failures, making it easier for teams to understand complex failure mechanisms.
- Prioritization of Actions: By focusing on the likelihood and severity of failure events, FTA helps prioritize corrective actions, allowing resources to be allocated effectively.
- Versatile Analysis: FTA accommodates both qualitative and quantitative risk assessments, providing a well-rounded approach to understanding system reliability.
- Inclusion of Human Error: Unlike some methodologies that overlook human factors, FTA includes potential human errors, offering a more comprehensive analysis.
Limitations
- Complexity in Large Systems: When applied to large systems, FTA can become overly complex, making it challenging to manage and interpret.
- Single Event Focus: FTA examines only one top event at a time, which can limit its scope when dealing with multiple interconnected failures.
- Expertise Required: Interpreting logical gates and failure data effectively requires experienced analysts, potentially limiting its accessibility to all teams.
- Time-Related Challenges: Capturing time-related factors and delays can be difficult, potentially impacting the accuracy of the analysis.
Real-World Applications of Fault Tree Analysis
Fault Tree Analysis (FTA) has been applied successfully across various industries to enhance safety, reliability, and cost-effectiveness. Here are some notable examples:
Aerospace: Boeing’s Safety Assurance
Boeing utilizes FTA to ensure the safety and reliability of its aircraft systems. By analyzing potential failure modes within complex systems, engineers can identify and mitigate risks before they manifest in real-world operations. This proactive approach helps maintain high safety standards and compliance with regulatory requirements.
Automotive: Preventing Component Failures
In the automotive industry, FTA is employed to prevent accidents by identifying potential component failures, such as brake malfunctions or tire blowouts. Car manufacturers use FTA to analyze the interaction of various vehicle systems and components, ensuring that vehicles perform safely under diverse conditions. By addressing these failure points, manufacturers can enhance vehicle safety and reliability.
Nuclear Power: Ensuring Reactor Safety
The nuclear power industry relies on FTA to ensure reactor safety by identifying failure paths that could lead to critical events. Through rigorous analysis, engineers can identify vulnerabilities within nuclear systems and implement design changes or safety protocols to prevent catastrophic failures. This application of FTA not only enhances safety but also builds public trust in nuclear energy.
Cost Reduction through Proactive Analysis
FTA has also helped companies reduce costs by proactively addressing the most likely failure causes. For example, a manufacturing company used FTA to analyze its production line, identifying key areas where failures were most likely to occur. By implementing targeted maintenance and design improvements, the company was able to prevent costly downtimes, improving overall operational efficiency.
In conclusion, FTA’s versatility and effectiveness in identifying and mitigating potential failures make it an invaluable tool across various industries. By applying FTA, organizations can enhance system reliability, ensure safety, and reduce operational costs, ultimately contributing to their long-term success.
FTA vs. Other Risk Analysis Tools (FMEA, RCA, Event Tree Analysis)
In the realm of risk analysis, Fault Tree Analysis (FTA) stands out for its unique approach, yet it is often compared to other methodologies such as Failure Mode and Effects Analysis (FMEA), Root Cause Analysis (RCA), and Event Tree Analysis (ETA). Understanding these differences can help organizations choose the right tool for their needs.
FTA vs. FMEA
While FTA and FMEA both aim to enhance system reliability, they differ in their focus and approach. FTA is concerned with identifying all possible failure causes of a specific top event. It uses a top-down, deductive process to trace the pathways that lead to a system failure. In contrast, FMEA focuses on identifying all possible failure modes for each component within a system. FMEA is more component-centric, analyzing the effects of each potential failure mode on the system. This makes FMEA particularly useful for detailed component analysis, while FTA provides a broader view of system-level failures.
FTA vs. Root Cause Analysis (RCA)
Root Cause Analysis (RCA) and FTA serve similar purposes but differ in methodology. FTA employs a top-down approach, starting with the undesired event and working backwards to identify possible causes. RCA, however, often adopts a bottom-up approach, beginning with known failures and tracing them back to their root causes. RCA is typically used after a failure has occurred to determine why it happened, whereas FTA is proactive, aiming to anticipate and prevent potential failures.
FTA vs. Event Tree Analysis (ETA)
Event Tree Analysis (ETA) is another methodology that contrasts with FTA. ETA starts with an initiating event and traces forward to explore possible outcomes, focusing on the progression of events following a specific incident. FTA, on the other hand, begins with an undesired event and traces its potential causes. While ETA is forward-looking, assessing potential consequences of an event, FTA is backward-looking, identifying the causes leading to a failure. Both methods can complement each other, offering a comprehensive view of risk scenarios.
Leveraging FTA for Better Risk Management and System Reliability
Fault Tree Analysis (FTA) offers a structured, visual approach to diagnosing and preventing system failures. By focusing on the potential causes of an undesired event, FTA provides deep insights into complex systems, enabling teams to prioritize risks and implement effective solutions. The benefits of FTA are particularly valuable in complex industries like aerospace, automotive, and nuclear power, where safety and reliability are critical.
Incorporating FTA into a broader risk management strategy can significantly improve operational safety, reliability, and performance. By understanding and mitigating potential failure paths, organizations can not only prevent costly downtimes and accidents but also enhance their overall system efficiency.