Table of Contents
Understanding Issue/Error Logs
An issue or error log is a powerful tool that helps track and resolve issues across various projects, especially in fields like software development, testing, or systems management. Imagine you’re managing a website, and an unexpected error causes a part of the site to go down. Without a record of the error details, finding the root cause could be time-consuming and frustrating. An error log, however, saves this information in real-time, letting you identify what went wrong and fix it faster.
Why is this important? Studies show that businesses lose an average of $5,600 per minute of downtime, costing around $300,000 per hour for large companies (Gartner, 2020). A well-maintained error log minimizes these losses by helping teams quickly identify and fix issues. In this guide, we’ll walk through the components of an effective error log, why it’s essential, and steps to create and use one effectively.
Key Components of an Effective Error Log

A well-organized error log makes troubleshooting smoother, and certain key components are essential for an error log to be effective. Let’s look at these:
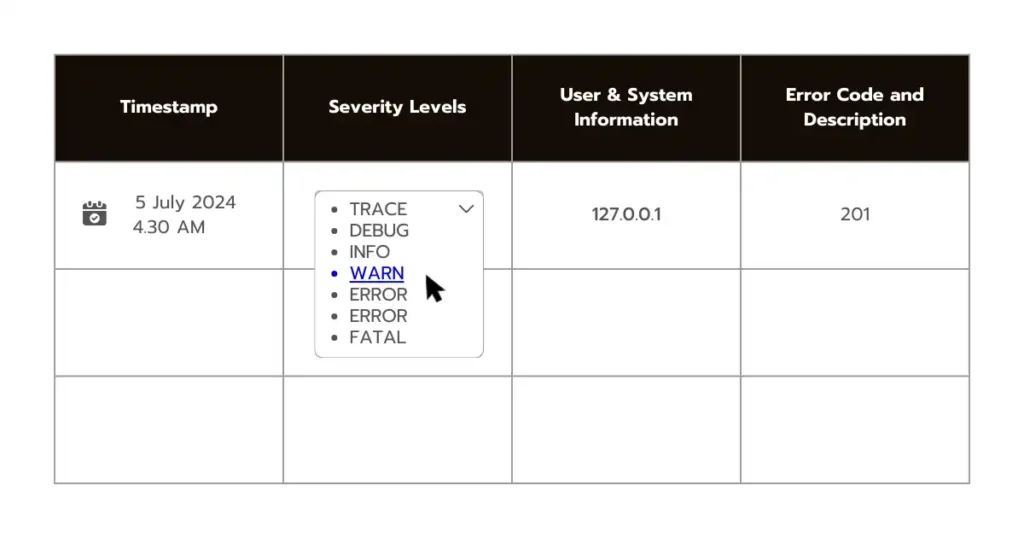
- Timestamp: The timestamp records the exact date and time an error occurs. This detail is crucial for tracking patterns. For example, if multiple errors occur around the same time every day, it might indicate an issue with scheduled tasks or server load during peak hours.
- Severity Levels: Error logs often classify issues by severity, using levels like TRACE, DEBUG, INFO, WARN, ERROR, and FATAL. Each level provides context:
- TRACE: Tracks minor processes, often used for debugging.
- DEBUG: Records details in test environments, useful during development.
- INFO: Logs standard operations, like process starts/stops.
- WARN: Indicates an unusual but non-critical issue (e.g., a temporary network lag).
- ERROR: Flags significant problems that need attention (e.g., failing connections).
- FATAL: Records critical issues that impact application performance.
- User & System Information: Including the user’s ID or IP address can be helpful, especially for systems accessed by multiple users. For example, if one user’s actions frequently cause errors, there may be a permissions issue to address.
- Error Code and Description: Each log entry should contain a unique error code (like “404” for a webpage not found) and a brief description, making it easier to identify patterns. For example, a sudden spike in “500” errors on a server might indicate an underlying issue with the server itself.
These components allow teams to spot trends and prevent future errors by analyzing detailed, structured data.
Why Error Logs are a Game-Changer in Project Management
Error logs are essential because they speed up issue resolution and help teams make informed decisions, ultimately improving project performance. Let’s explore some specific ways error logs add value:
- Faster Troubleshooting: Without error logs, identifying and fixing issues is like searching for a needle in a haystack. Research shows that companies with well-organized error logging systems resolve issues up to 65% faster than those without logs (IT Management Survey, 2021). By using timestamps, error codes, and descriptions, teams can pinpoint errors in seconds, rather than hours.
- Data-Driven Decision-Making: Error logs give insights into patterns and trends. For instance, if a system logs frequent memory errors, it may signal the need for a hardware upgrade. Logs also reveal how often specific errors occur, allowing teams to prioritize critical fixes. Analyzing historical logs helps companies decide which systems require more resources or upgrades.
- Improved Performance and User Experience: By monitoring error logs, you can detect performance bottlenecks early on. For example, if error logs show that an application frequently crashes when processing large files, this points to a capacity issue. Addressing this not only enhances performance but also minimizes downtime, leading to a better user experience.
Error logs also enhance security by alerting teams to potential vulnerabilities. A sudden increase in failed login attempts, for example, could indicate a security threat, prompting a swift response.
Steps to Create and Maintain an Error Log
Creating and maintaining an error log doesn’t need to be complex, but consistency and clarity are key. Here’s a step-by-step guide:
- Choose a Logging Format: Select a format that suits your project needs. JSON and XML formats are popular due to their readability and compatibility with various analysis tools. For instance, JSON logs can be easily parsed by most log management systems, making it a good choice for large-scale projects.
- Define Log Levels and Consistently Apply Them: Use TRACE, DEBUG, INFO, WARN, ERROR, and FATAL levels to organize logs by severity. This allows teams to prioritize critical errors over less severe ones. For example, set ERROR or FATAL for issues that disrupt users, while using INFO for basic system status updates.
- Set Up Alerts for Critical Errors: Configure alerts for FATAL or ERROR-level events to notify team members immediately. A well-placed alert can reduce mean time to resolution (MTTR) significantly. According to a 2022 study by Logz.io, real-time alerts reduce MTTR by an average of 23% in organizations.
- Establish Consistent Fields: Include fields such as timestamp, error code, severity, user ID, and a description. Consistent fields ensure logs are easier to read and analyze. A clear description field helps users understand the cause of the issue, such as “Database connection timeout due to network congestion.”
- Regularly Review and Archive Logs: Logs can accumulate quickly, making it important to regularly review and archive them. Archived logs also provide valuable historical data for analyzing recurring issues. Some companies archive logs quarterly or yearly, depending on storage needs.
- Use Log Management Tools for Centralization: Tools like Splunk, Loggly, and Sentry allow you to centralize error logs and filter or search for specific log entries. Using a central log management system saves time and simplifies the troubleshooting process, especially for large projects.
By following these steps, you can create a robust error log system that not only records issues but actively aids in resolving them.
Using Error Logs for Proactive Issue Management
Error logs aren’t just for reactive fixes—they can be valuable tools for proactive management as well. By analyzing logs consistently, teams can address recurring issues before they impact users. Here’s how:
- Setting Alerts and Notifications: Real-time alerts for critical log entries (like FATAL errors) ensure that teams are notified the moment a major issue occurs. This minimizes downtime and helps meet Service Level Agreements (SLAs), which are critical in industries where every minute of system downtime costs money.
- Trend Analysis for Predictive Maintenance: Error logs allow teams to observe patterns over time. For example, if the logs show a regular increase in memory usage that reaches a threshold, the team might upgrade the system’s memory capacity before it crashes. According to IT analysts, predictive maintenance can reduce unexpected downtimes by up to 50% (Gartner, 2023).
- Creating a Knowledge Base: Logs can be used to document common issues and their solutions, serving as a reference for future troubleshooting. This practice improves the efficiency of IT and development teams, reducing time spent on familiar issues.
- Using Logs for Security Monitoring: Security-related errors, like multiple failed login attempts, are often early indicators of potential threats. Monitoring for these types of errors can alert your team to take immediate action, such as locking accounts or enhancing security protocols, protecting your application from potential breaches.
Proactively managing logs means fewer surprises, improved system reliability, and a smoother experience for users.
Templates and Tools to Enhance Your Error Logging
Implementing the right tools and templates can make error logging simpler and more effective. Here are some resources to help:
- Error Log Templates: Start with templates designed for different project needs. A basic template may include fields like timestamp, severity, user ID, error code, and description. For complex projects, you might add fields for IP addresses, device details, and more. This standardization saves time and keeps logs consistent.
- Popular Logging Tools: Tools like Sentry, Loggly, and Splunk make it easy to centralize, search, and analyze error logs. These platforms also provide real-time alerts, automated reports, and customizable dashboards, letting teams visualize data and detect patterns faster. For example, Sentry’s interface allows developers to track application performance and error frequency, making it a favorite among development teams.
- Customizable Logging Frameworks: If your project requires a custom solution, frameworks like Log4j (Java) or Winston (Node.js) offer flexibility to tailor error logs to your exact needs. These frameworks also integrate easily with third-party tools, making it easier to build a logging system that grows with your project.
Using templates and tools streamlines the logging process, making error logs more accessible and actionable for all team members.
Common Challenges in Error Logging and How to Overcome Them
Effective error logging can be challenging. Here are common obstacles and how to overcome them:
- Data Overload: Large-scale projects generate a massive volume of logs, which can make it difficult to find relevant data. Use filters and log levels (DEBUG, ERROR, etc.) to capture only essential entries. This approach prevents clutter and allows you to focus on high-priority issues.
- Log Maintenance: Storing logs long-term can become expensive and unwieldy. Many organizations archive logs quarterly or yearly to balance data accessibility with storage costs. Consider using log management tools with automated archiving features to make this process easier.
- Alert Fatigue: Receiving too many alerts can desensitize teams to warnings, potentially causing critical errors to be overlooked. To avoid alert fatigue, configure alerts only for FATAL or ERROR-level events, and route them to the appropriate team. According to a study by Datadog, 75% of IT teams experience alert fatigue (2022), emphasizing the need for targeted notifications.
- Log Format Consistency: Inconsistent log formats can hinder analysis. Implement standard fields (e.g., timestamp, error code, description) and enforce format rules to ensure clarity. Using JSON or XML structures also helps keep entries readable and compatible with analysis tools.
Addressing these challenges makes your error log system more manageable, actionable, and valuable.
Harnessing the Power of Error Logs
Error logs are invaluable tools for identifying, managing, and preventing issues in any project. With the right setup, they can transform troubleshooting from a reactive process into a proactive, data-driven approach. By integrating log levels, setting up alerts, and regularly analyzing log trends, teams can enhance system performance, improve security, and provide a better experience for end users. Start by implementing a structured logging system, and make use of the tools and templates available to maximize its effectiveness. Remember, a well-maintained error log is more than a record—it’s a roadmap to better project management and operational efficiency.
FAQs
Where can I find error logs in a typical software application?
Most applications store error logs in designated folders, often under system or application directories. For example, web servers like Apache store logs in /var/log on Linux.
How can I differentiate between critical and non-critical errors?
Use log levels. FATAL or ERROR levels indicate critical errors requiring immediate action, while INFO and WARN logs are less urgent.
Can error logs help with performance monitoring?
Yes! Error logs can reveal patterns like memory issues, system slowdowns, or network delays, guiding improvements in application performance.
How can I analyze trends in error logs?
Log management tools like Splunk or Sentry offer dashboards and reporting features for trend analysis, making it easy to spot recurring issues.
Are error logs useful for security monitoring?
Absolutely. Error logs often highlight suspicious activities, such as failed login attempts or unauthorized access, helping teams to take proactive security measures.


